# Trying out Elastic Beats
> Explore Elastic Beats for data shipping in DevOps. Learn to set up and configure Metricbeat on Docker Swarm for system and Docker metrics analysis.
- Canonical: https://www.russ.cloud/2017/01/02/trying-out-elastic-beats/
- Published: 2017-01-02
- Author: Russ McKendrick
- Tags: Docker, DevOps, Tools
---
 I thought it was about time, as I had some to spare today, to have a play with one of the new feature of the Elastic family of products I have yet to try.
> Beats is the platform for single-purpose data shippers. They install as lightweight agents and send data from hundreds or thousands of machines to Logstash or Elasticsearch.
I have [used an ELK stack before](https://media-glass.es/installing-an-elk-stack-on-centos-7-5ca8e6840b37#.eqclbbc6w) but never for metrics, it always been for more traditional log files and tools such as [Zabbix](http://www.zabbix.com/) have been my goto for metrics.
Before going any further it should be pointed out that **this is in no way a production configuration**, there is no high availability, storage volumes used or any thought around security, it is just a proof of concept.
#### Launching an Elastic Stack
As I needed somewhere to send my metrics to I decided to use Docker Machine (Docker again, now there is a surprise) to launch three Docker hosts in [DigitalOcean](https://m.do.co/c/52ec4dc3647e), configure a Swarm and then create an Elasticsearch & Kibana service.
To do this, I first launched a manager host;
```bash frame="terminal" title="Trying out Elastic Beats 1/21"
docker-machine create \
--driver digitalocean \
--digitalocean-access-token your-do-token-goes-here \
--digitalocean-region lon1 \
--digitalocean-size 2gb \
manager
```
Then two workers;
```bash frame="terminal" title="Trying out Elastic Beats 2/21"
docker-machine create \
--driver digitalocean \
--digitalocean-access-token your-do-token-goes-here \
--digitalocean-region lon1 \
--digitalocean-size 2gb \
worker01
docker-machine create \
--driver digitalocean \
--digitalocean-access-token your-do-token-goes-here \
--digitalocean-region lon1 \
--digitalocean-size 2gb \
worker02
```
Once I had all three Docker hosts online I ran the following to make sure that the Elasticseach container would launch;
```bash frame="terminal" title="Trying out Elastic Beats 3/21"
docker-machine ssh worker01 sudo sysctl -w vm.max_map_count=262144
docker-machine ssh worker02 sudo sysctl -w vm.max_map_count=262144
```
Notice that I only ran the commands on the two worker nodes, I am going to keep my Elastic stack on just these two hosts.
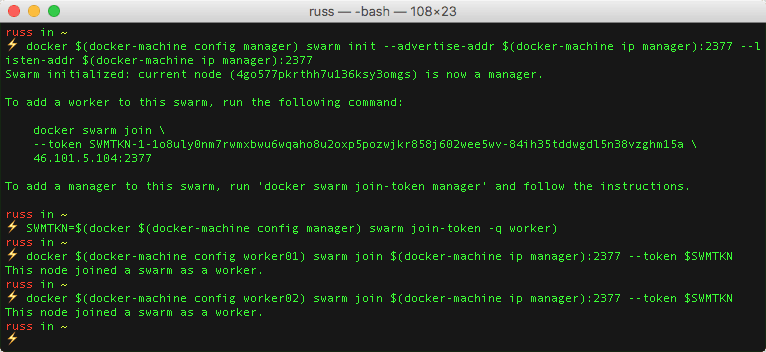
Now that my three Docker hosts are available and configured I created the Docker Swarm cluster by running the following commands;
```bash frame="terminal" title="Trying out Elastic Beats 4/21"
docker $(docker-machine config manager) swarm init --advertise-addr $(docker-machine ip manager):2377 --listen-addr $(docker-machine ip manager):2377
SWMTKN=$(docker $(docker-machine config manager) swarm join-token -q worker)
docker $(docker-machine config worker01) swarm join $(docker-machine ip manager):2377 --token $SWMTKN
docker $(docker-machine config worker02) swarm join $(docker-machine ip manager):2377 --token $SWMTKN
```
I thought it was about time, as I had some to spare today, to have a play with one of the new feature of the Elastic family of products I have yet to try.
> Beats is the platform for single-purpose data shippers. They install as lightweight agents and send data from hundreds or thousands of machines to Logstash or Elasticsearch.
I have [used an ELK stack before](https://media-glass.es/installing-an-elk-stack-on-centos-7-5ca8e6840b37#.eqclbbc6w) but never for metrics, it always been for more traditional log files and tools such as [Zabbix](http://www.zabbix.com/) have been my goto for metrics.
Before going any further it should be pointed out that **this is in no way a production configuration**, there is no high availability, storage volumes used or any thought around security, it is just a proof of concept.
#### Launching an Elastic Stack
As I needed somewhere to send my metrics to I decided to use Docker Machine (Docker again, now there is a surprise) to launch three Docker hosts in [DigitalOcean](https://m.do.co/c/52ec4dc3647e), configure a Swarm and then create an Elasticsearch & Kibana service.
To do this, I first launched a manager host;
```bash frame="terminal" title="Trying out Elastic Beats 1/21"
docker-machine create \
--driver digitalocean \
--digitalocean-access-token your-do-token-goes-here \
--digitalocean-region lon1 \
--digitalocean-size 2gb \
manager
```
Then two workers;
```bash frame="terminal" title="Trying out Elastic Beats 2/21"
docker-machine create \
--driver digitalocean \
--digitalocean-access-token your-do-token-goes-here \
--digitalocean-region lon1 \
--digitalocean-size 2gb \
worker01
docker-machine create \
--driver digitalocean \
--digitalocean-access-token your-do-token-goes-here \
--digitalocean-region lon1 \
--digitalocean-size 2gb \
worker02
```
Once I had all three Docker hosts online I ran the following to make sure that the Elasticseach container would launch;
```bash frame="terminal" title="Trying out Elastic Beats 3/21"
docker-machine ssh worker01 sudo sysctl -w vm.max_map_count=262144
docker-machine ssh worker02 sudo sysctl -w vm.max_map_count=262144
```
Notice that I only ran the commands on the two worker nodes, I am going to keep my Elastic stack on just these two hosts.
Now that my three Docker hosts are available and configured I created the Docker Swarm cluster by running the following commands;
```bash frame="terminal" title="Trying out Elastic Beats 4/21"
docker $(docker-machine config manager) swarm init --advertise-addr $(docker-machine ip manager):2377 --listen-addr $(docker-machine ip manager):2377
SWMTKN=$(docker $(docker-machine config manager) swarm join-token -q worker)
docker $(docker-machine config worker01) swarm join $(docker-machine ip manager):2377 --token $SWMTKN
docker $(docker-machine config worker02) swarm join $(docker-machine ip manager):2377 --token $SWMTKN
```
 I checked that all three Docker hosts were correctly in the cluster;
```bash frame="terminal" title="Trying out Elastic Beats 5/21"
docker $(docker-machine config manager) node ls
```
I checked that all three Docker hosts were correctly in the cluster;
```bash frame="terminal" title="Trying out Elastic Beats 5/21"
docker $(docker-machine config manager) node ls
```
 Everything was as expected, it was time to launch the Elasticsearch and Kibana services. I started by creating an overlay network called elk;
```bash frame="terminal" title="Trying out Elastic Beats 6/21"
docker $(docker-machine config manager) network create --driver overlay elk
```
Everything was as expected, it was time to launch the Elasticsearch and Kibana services. I started by creating an overlay network called elk;
```bash frame="terminal" title="Trying out Elastic Beats 6/21"
docker $(docker-machine config manager) network create --driver overlay elk
```
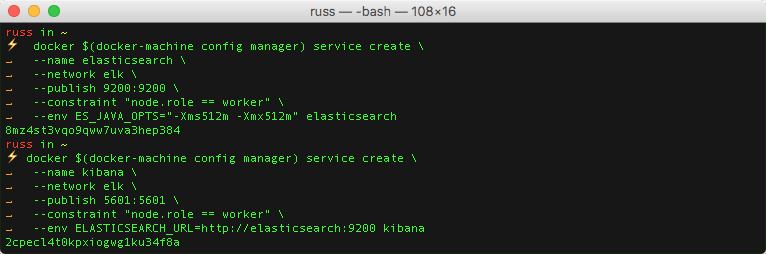
 Then I created the Elasticsearch service;
```bash frame="terminal" title="Trying out Elastic Beats 7/21"
docker $(docker-machine config manager) service create \
--name elasticsearch \
--network elk \
--publish 9200:9200 \
--constraint "node.role == worker" \
--env ES_JAVA_OPTS="-Xms512m -Xmx512m" \
elasticsearch
```
Followed by the Kibana service;
```bash frame="terminal" title="Trying out Elastic Beats 8/21"
docker $(docker-machine config manager) service create \
--name kibana \
--network elk \
--publish 5601:5601 \
--constraint "node.role == worker" \
--env ELASTICSEARCH_URL=http://elasticsearch:9200 \
kibana
```
Then I created the Elasticsearch service;
```bash frame="terminal" title="Trying out Elastic Beats 7/21"
docker $(docker-machine config manager) service create \
--name elasticsearch \
--network elk \
--publish 9200:9200 \
--constraint "node.role == worker" \
--env ES_JAVA_OPTS="-Xms512m -Xmx512m" \
elasticsearch
```
Followed by the Kibana service;
```bash frame="terminal" title="Trying out Elastic Beats 8/21"
docker $(docker-machine config manager) service create \
--name kibana \
--network elk \
--publish 5601:5601 \
--constraint "node.role == worker" \
--env ELASTICSEARCH_URL=http://elasticsearch:9200 \
kibana
```
 After a minute I checked that the two services were running as expected using;
```bash frame="terminal" title="Trying out Elastic Beats 9/21"
docker $(docker-machine config manager) service ls
```
After a minute I checked that the two services were running as expected using;
```bash frame="terminal" title="Trying out Elastic Beats 9/21"
docker $(docker-machine config manager) service ls
```
 I now had my Elastic stack up and running.
#### Installing Metricbeats
Now that I had my three hosts running and an Elastic stack ready to ingest data I need to install some Beats on the host. Looking at the available Beats I decided to go with the [Metricbeat](https://www.elastic.co/products/beats/metricbeat) as this covered all of the basics I wanted;
> System-Level Monitoring, Simplified; Deploy Metricbeat on all your Linux, Windows, and Mac hosts, connect it to Elasticsearch and voila: you get system-level CPU usage, memory, file system, disk IO, and network IO statistics, as well as top-like statistics for every process running on your systems.
As Docker Machine provides an SSH command, I decided to continue to use that to install and configure the service. Before installing I grabbed the IP address of the Manager node so I could use it when configuring Metricbeat, to do this I ran the following;
```bash frame="terminal" title="Trying out Elastic Beats 10/21"
SWMIP=$(docker-machine ip manager)
```
I should be able to use $SWMIP where I need to need to use the IP address of a host within the Swarm Cluster. Remember, as I launched the Elastic stack as a service hosted on an overlay network I should be able to hit any of my three nodes to be routed to the correct container.
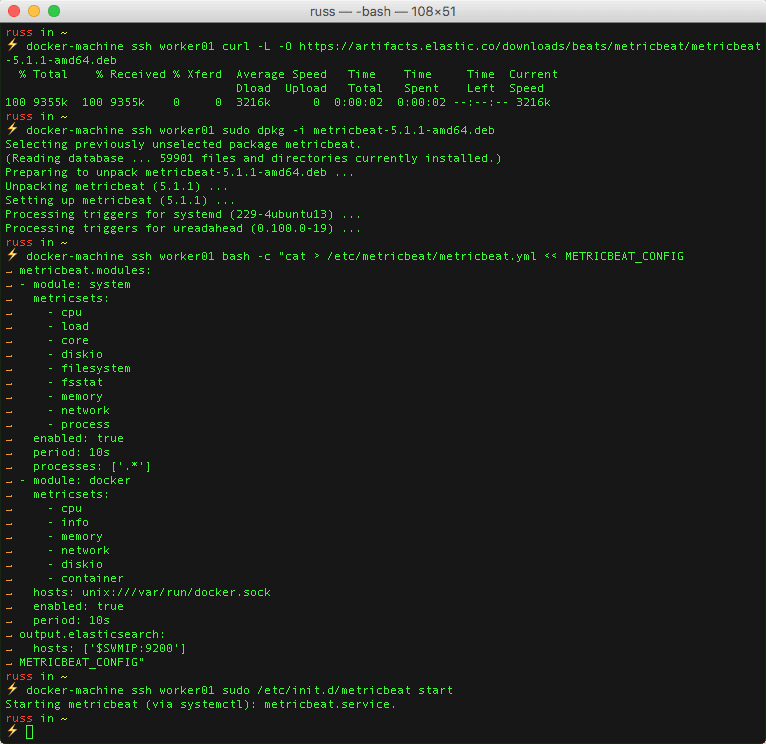
I started by installing Metricbeats on worker01, first of all by downloading and installing the deb package;
```bash frame="terminal" title="Trying out Elastic Beats 11/21"
docker-machine ssh worker01 curl -L -O https://artifacts.elastic.co/downloads/beats/metricbeat/metricbeat-5.1.1-amd64.deb
docker-machine ssh worker01 sudo dpkg -i metricbeat-5.1.1-amd64.deb
```
Once I had installed the deb package I configured Elasticbeat by running the following command which overwrote the default configuration file;
```bash frame="terminal" title="Trying out Elastic Beats 12/21"
docker-machine ssh worker01 bash -c "cat > /etc/metricbeat/metricbeat.yml << METRICBEAT_CONFIG
metricbeat.modules:
- module: system
metricsets:
- cpu
- load
- core
- diskio
- filesystem
- fsstat
- memory
- network
- process
enabled: true
period: 10s
processes: ['.*']
- module: docker
metricsets:
- cpu
- info
- memory
- network
- diskio
- container
hosts: unix:///var/run/docker.sock
enabled: true
period: 10s
output.elasticsearch:
hosts: ['$SWMIP:9200']
METRICBEAT_CONFIG"
```
The configuration file enables two Metricbeat modules;
- **system**; this is the default module which collects host metrics such as the ones listed under “metricsets”.
- **docker**; this is an experimental module which gathers metrics on both the Docker hosts and the containers running on them, notice that I have configured it to use the socket file rather connecting to the Docker API using a network socket.
Also, at the end of the configuration, we tell Metricbeat where our Elasticsearch container is accessible for it to send data.
Once the configuration file was in place I started the service by running;
```bash frame="terminal" title="Trying out Elastic Beats 13/21"
docker-machine ssh worker01 sudo /etc/init.d/metricbeat start
```
I now had my Elastic stack up and running.
#### Installing Metricbeats
Now that I had my three hosts running and an Elastic stack ready to ingest data I need to install some Beats on the host. Looking at the available Beats I decided to go with the [Metricbeat](https://www.elastic.co/products/beats/metricbeat) as this covered all of the basics I wanted;
> System-Level Monitoring, Simplified; Deploy Metricbeat on all your Linux, Windows, and Mac hosts, connect it to Elasticsearch and voila: you get system-level CPU usage, memory, file system, disk IO, and network IO statistics, as well as top-like statistics for every process running on your systems.
As Docker Machine provides an SSH command, I decided to continue to use that to install and configure the service. Before installing I grabbed the IP address of the Manager node so I could use it when configuring Metricbeat, to do this I ran the following;
```bash frame="terminal" title="Trying out Elastic Beats 10/21"
SWMIP=$(docker-machine ip manager)
```
I should be able to use $SWMIP where I need to need to use the IP address of a host within the Swarm Cluster. Remember, as I launched the Elastic stack as a service hosted on an overlay network I should be able to hit any of my three nodes to be routed to the correct container.
I started by installing Metricbeats on worker01, first of all by downloading and installing the deb package;
```bash frame="terminal" title="Trying out Elastic Beats 11/21"
docker-machine ssh worker01 curl -L -O https://artifacts.elastic.co/downloads/beats/metricbeat/metricbeat-5.1.1-amd64.deb
docker-machine ssh worker01 sudo dpkg -i metricbeat-5.1.1-amd64.deb
```
Once I had installed the deb package I configured Elasticbeat by running the following command which overwrote the default configuration file;
```bash frame="terminal" title="Trying out Elastic Beats 12/21"
docker-machine ssh worker01 bash -c "cat > /etc/metricbeat/metricbeat.yml << METRICBEAT_CONFIG
metricbeat.modules:
- module: system
metricsets:
- cpu
- load
- core
- diskio
- filesystem
- fsstat
- memory
- network
- process
enabled: true
period: 10s
processes: ['.*']
- module: docker
metricsets:
- cpu
- info
- memory
- network
- diskio
- container
hosts: unix:///var/run/docker.sock
enabled: true
period: 10s
output.elasticsearch:
hosts: ['$SWMIP:9200']
METRICBEAT_CONFIG"
```
The configuration file enables two Metricbeat modules;
- **system**; this is the default module which collects host metrics such as the ones listed under “metricsets”.
- **docker**; this is an experimental module which gathers metrics on both the Docker hosts and the containers running on them, notice that I have configured it to use the socket file rather connecting to the Docker API using a network socket.
Also, at the end of the configuration, we tell Metricbeat where our Elasticsearch container is accessible for it to send data.
Once the configuration file was in place I started the service by running;
```bash frame="terminal" title="Trying out Elastic Beats 13/21"
docker-machine ssh worker01 sudo /etc/init.d/metricbeat start
```
 I then repeated the process on worker02 and manager by replacing worker01 in the `docker-machine ssh `commands.
Before I logging into Kibana there are two more things that I needed to do, first of all, import the Metricbeat template, to do this I ran;
```bash frame="terminal" title="Trying out Elastic Beats 14/21"
docker-machine ssh manager curl -XPUT "http://$SWMIP:9200/_template/metricbeat" -d@/etc/metricbeat/metricbeat.template.json
```
Then, I ran a script to import the pre-built Kibana Dashboards by running;
```bash frame="terminal" title="Trying out Elastic Beats 15/21"
docker-machine ssh manager sudo /usr/share/metricbeat//scripts/import_dashboards -es http://$SWMIP:9200
```
#### Viewing the Metrics Dashboard
Now that I had installed and configured Metricbeat on all three hosts and readied Elasticsearch and Kibana it was time to open the Kibana dashboard.
To do this, I ran the following command;
```bash frame="terminal" title="Trying out Elastic Beats 16/21"
open http://$(docker-machine ip manager):5601
```
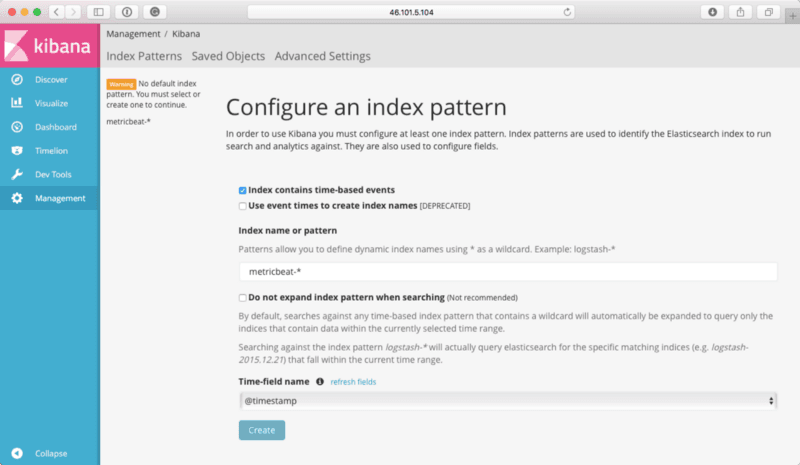
Like all other Kibana installations, the first thing I needed to do was configure an index pattern, to do this I entered `metricbeat-*`and selected `@timestamp`from the drop-down list;
I then repeated the process on worker02 and manager by replacing worker01 in the `docker-machine ssh `commands.
Before I logging into Kibana there are two more things that I needed to do, first of all, import the Metricbeat template, to do this I ran;
```bash frame="terminal" title="Trying out Elastic Beats 14/21"
docker-machine ssh manager curl -XPUT "http://$SWMIP:9200/_template/metricbeat" -d@/etc/metricbeat/metricbeat.template.json
```
Then, I ran a script to import the pre-built Kibana Dashboards by running;
```bash frame="terminal" title="Trying out Elastic Beats 15/21"
docker-machine ssh manager sudo /usr/share/metricbeat//scripts/import_dashboards -es http://$SWMIP:9200
```
#### Viewing the Metrics Dashboard
Now that I had installed and configured Metricbeat on all three hosts and readied Elasticsearch and Kibana it was time to open the Kibana dashboard.
To do this, I ran the following command;
```bash frame="terminal" title="Trying out Elastic Beats 16/21"
open http://$(docker-machine ip manager):5601
```
Like all other Kibana installations, the first thing I needed to do was configure an index pattern, to do this I entered `metricbeat-*`and selected `@timestamp`from the drop-down list;
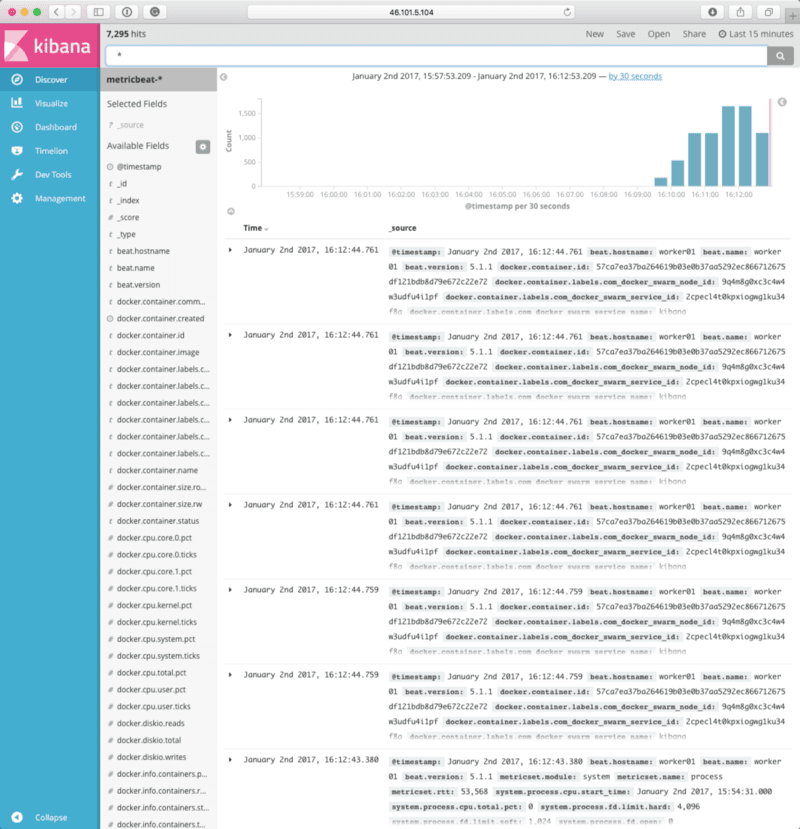
 Once that index pattern had been configured clicking on **Discover** took me to the following view, as you can see, I was receiving metrics from my three hosts;
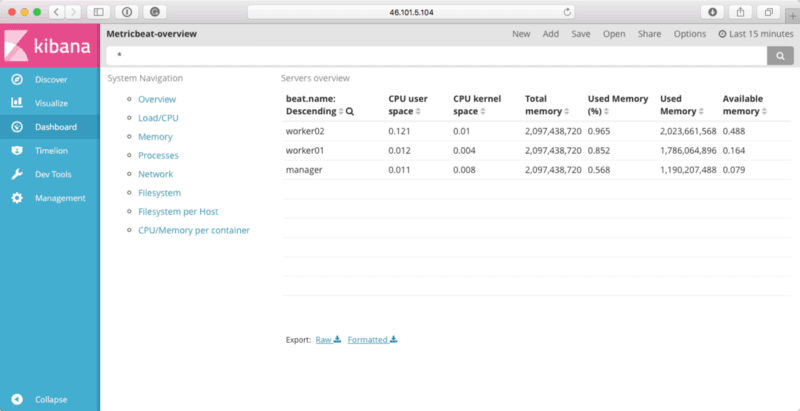
 Clicking on **Dashboard**, and then selecting **Metricbeat-overview** gave me the following view;
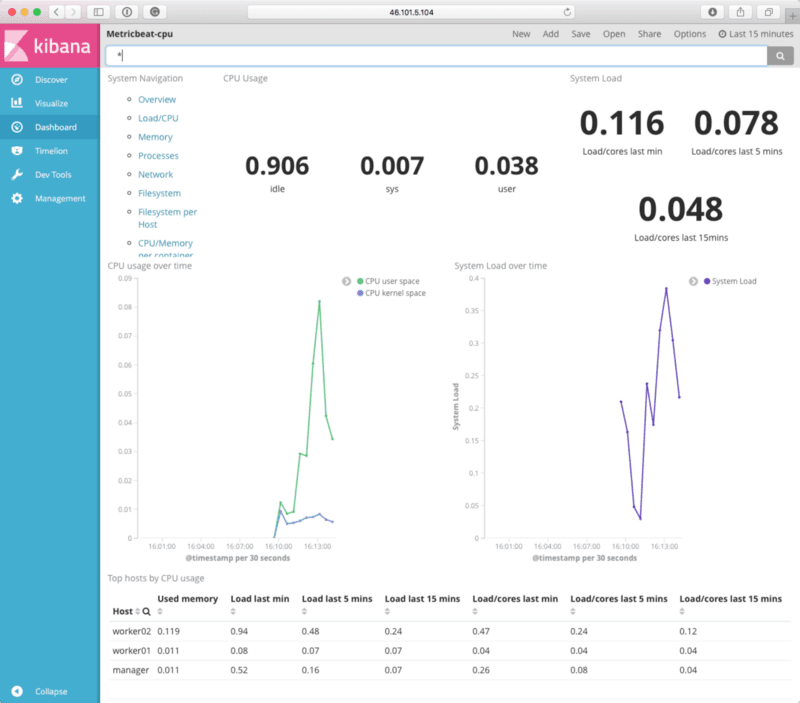
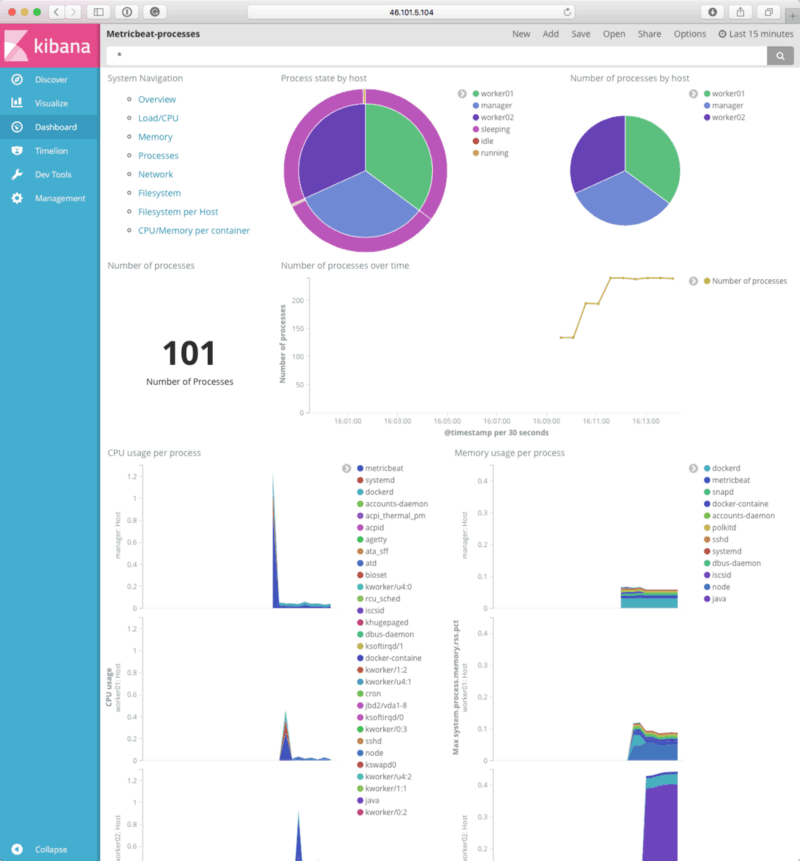
 From there I clicked on **Load/CPU** and **Processes** gave me the following dashboards;
 So far, so good. Before moving onto the Docker dashboards, I decided to launch a few more services. To do this, I ran the following;
```bash frame="terminal" title="Trying out Elastic Beats 17/21"
docker $(docker-machine config manager) network create -d overlay clusternetwork
docker $(docker-machine config manager) service create \
--name cluster\
--replicas 3 \
--publish 80:80/tcp \
--network clusternetwork \
russmckendrick/cluster
```
This created a service which launched three basic containers using the image from [russmckendrick/cluster](https://hub.docker.com/r/russmckendrick/cluster/) and then made them available on port 80 on all three hosts.
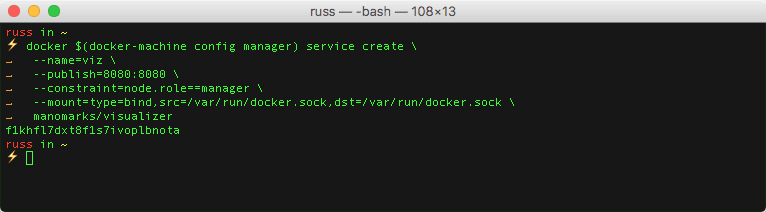
Then I launched a service using [manomarks/visualizer](https://hub.docker.com/r/dockersamples/visualizer/), this gives you a visual representation of your Docker Swarm cluster. To this I ran;
```bash frame="terminal" title="Trying out Elastic Beats 18/21"
docker $(docker-machine config manager) service create \
--name viz \
--publish 8080:8080 \
--constraint node.role==manager \
--mount type=bind,src=/var/run/docker.sock,dst=/var/run/docker.sock \
manomarks/visualizer
```
So far, so good. Before moving onto the Docker dashboards, I decided to launch a few more services. To do this, I ran the following;
```bash frame="terminal" title="Trying out Elastic Beats 17/21"
docker $(docker-machine config manager) network create -d overlay clusternetwork
docker $(docker-machine config manager) service create \
--name cluster\
--replicas 3 \
--publish 80:80/tcp \
--network clusternetwork \
russmckendrick/cluster
```
This created a service which launched three basic containers using the image from [russmckendrick/cluster](https://hub.docker.com/r/russmckendrick/cluster/) and then made them available on port 80 on all three hosts.
Then I launched a service using [manomarks/visualizer](https://hub.docker.com/r/dockersamples/visualizer/), this gives you a visual representation of your Docker Swarm cluster. To this I ran;
```bash frame="terminal" title="Trying out Elastic Beats 18/21"
docker $(docker-machine config manager) service create \
--name viz \
--publish 8080:8080 \
--constraint node.role==manager \
--mount type=bind,src=/var/run/docker.sock,dst=/var/run/docker.sock \
manomarks/visualizer
```
 Running the following showed me my cluster
```bash frame="terminal" title="Trying out Elastic Beats 19/21"
open http://$(docker-machine ip manager)/
```
Then running;
```bash frame="terminal" title="Trying out Elastic Beats 20/21"
open http://$(docker-machine ip manager):8080
```
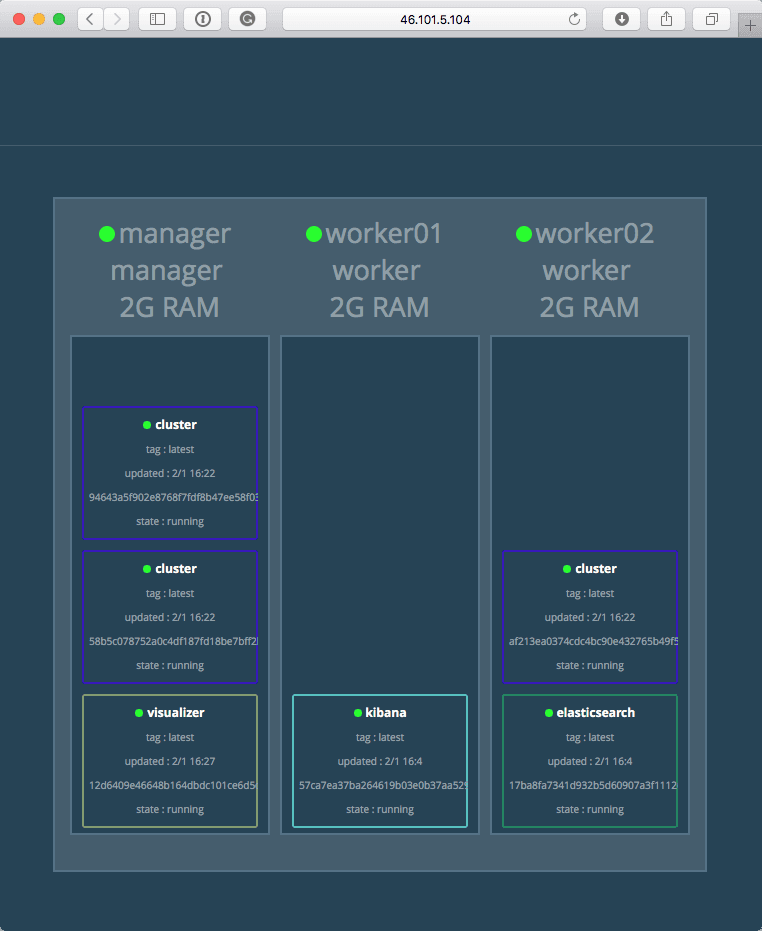
Opened my browsers and showed me how my Swarm cluster was organised;
Running the following showed me my cluster
```bash frame="terminal" title="Trying out Elastic Beats 19/21"
open http://$(docker-machine ip manager)/
```
Then running;
```bash frame="terminal" title="Trying out Elastic Beats 20/21"
open http://$(docker-machine ip manager):8080
```
Opened my browsers and showed me how my Swarm cluster was organised;
 Going back to Kibana, I selected the **Metricbeat Docker** dashboard and was greeted by the following;
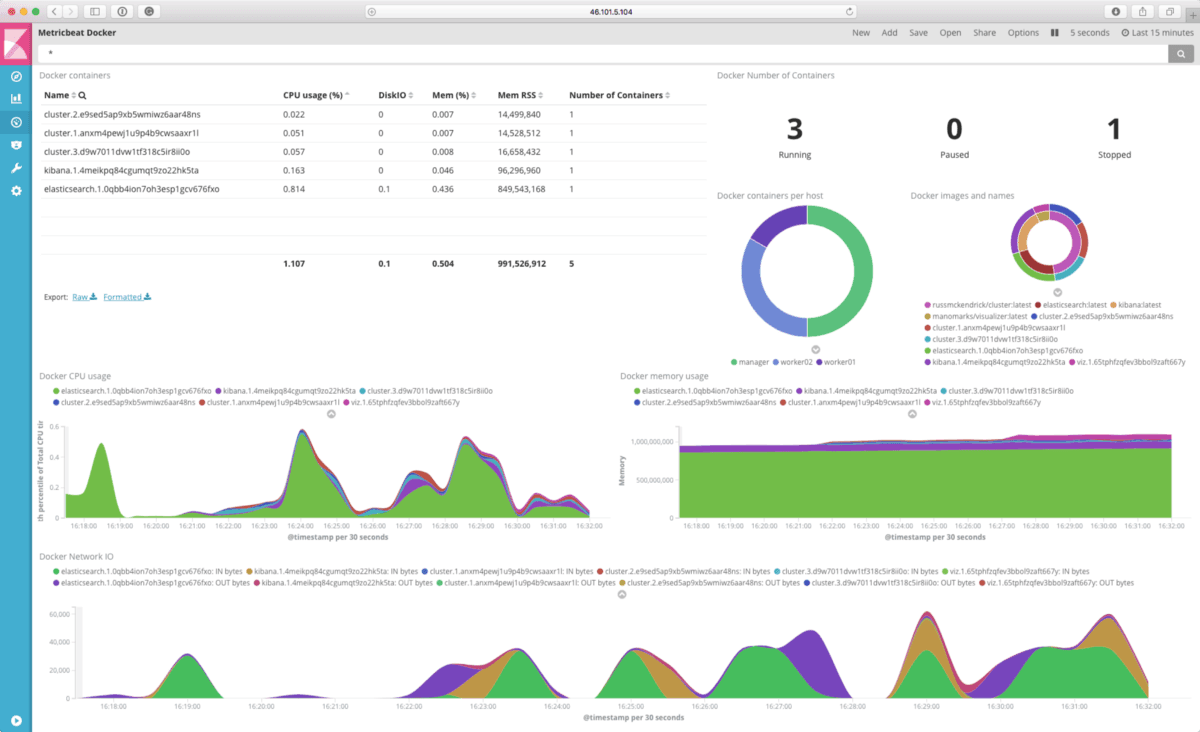 The dashboard is exactly what I was expecting to see, selecting the container from the list on the top left shows just the metrics for the selected container. At this point, my time ran out, so I tore down the cluster by running;
```bash frame="terminal" title="Trying out Elastic Beats 21/21"
docker-machine rm manager worker01 worker02
```
After dipping my toe in the water I think it is something I am going to be looking into more, there are plenty of other Beats available;
- [Filebeat](https://www.elastic.co/products/beats/filebeat)
- [Packetbeat](https://www.elastic.co/products/beats/packetbeat)
- [List of community Beats](https://www.elastic.co/guide/en/beats/libbeat/current/community-beats.html)
The following talk from OSDC 2016 gives a good idea about the sort of things you can use Beats for;
The dashboard is exactly what I was expecting to see, selecting the container from the list on the top left shows just the metrics for the selected container. At this point, my time ran out, so I tore down the cluster by running;
```bash frame="terminal" title="Trying out Elastic Beats 21/21"
docker-machine rm manager worker01 worker02
```
After dipping my toe in the water I think it is something I am going to be looking into more, there are plenty of other Beats available;
- [Filebeat](https://www.elastic.co/products/beats/filebeat)
- [Packetbeat](https://www.elastic.co/products/beats/packetbeat)
- [List of community Beats](https://www.elastic.co/guide/en/beats/libbeat/current/community-beats.html)
The following talk from OSDC 2016 gives a good idea about the sort of things you can use Beats for;