
Over the last year or so, every AI coding provider seems to have settled on the same pricing direction: token-based billing. Claude Code, Codex, Cursor, Copilot, and Gemini all now meter you on input, output, cache reads, cache writes, and (in some cases) reasoning tokens, and the bill at the end of the month reflects how chatty you’ve been with the model rather than a flat subscription.
Which is fine, until you start wondering where the money actually went.
Vibe coding makes that worse, not better. When you’re cheerfully throwing prompts at the model and pasting in screenshots, the per-turn cost is the last thing on your mind, but it does add up.
I’d been using a couple of existing tools to keep an eye on this, and they did the job for the basics (totals per day, totals per project) but I kept hitting limitations. I wanted to see costs in pounds rather than always having to do the conversion in my head. I wanted to drill into a specific session and see the prompt that triggered a particularly expensive turn. I wanted to compare Claude Code and Codex side by side on the same project, because I tend to use both depending on the task. None of the existing tools quite did all of that, so I built Token Use.

What it does
Token Use reads the session files that AI coding tools already write to your local disk, normalises the data into a single archive, and shows you what you’re spending. There’s no API key, no proxy, no telemetry endpoint, no daemon, and no live file watcher. It just parses the JSONL (and one SQLite database, in Cursor’s case) that your tools have already written, then renders the results.
It currently supports five sources:
| Tool | Source format | Token quality |
|---|---|---|
| Claude Code | JSONL session files under ~/.claude/projects/ | Exact, including cache reads and writes |
| Codex | JSONL rollouts under ~/.codex/sessions/ | Exact per-turn token deltas, plus rate-limit snapshots |
| Cursor | SQLite state.vscdb and Agent transcripts under ~/.cursor/projects/ | Exact when present, estimated otherwise |
| GitHub Copilot | Legacy CLI events and VS Code Copilot Chat transcripts | Exact for legacy, estimated for transcripts |
| Gemini CLI | Chat files under ~/.gemini/tmp/<project_hash>/chats/ | Exact, including cached input reads and thought tokens |
It comes in two flavours: a Rust-based TUI for the terminal, and a Tauri desktop app for when you’d rather have a window with a sidebar and clickable rows. Both share the same local archive, so whichever you launch shows the same data, and they share the same embedded keymap so the shortcuts work the same in either place.
The meta moment
Before we get into installing and using it, I want to show you the obvious thing: I built Token Use using Claude Code and Codex, which means Token Use has a very detailed record of what Token Use cost to build.
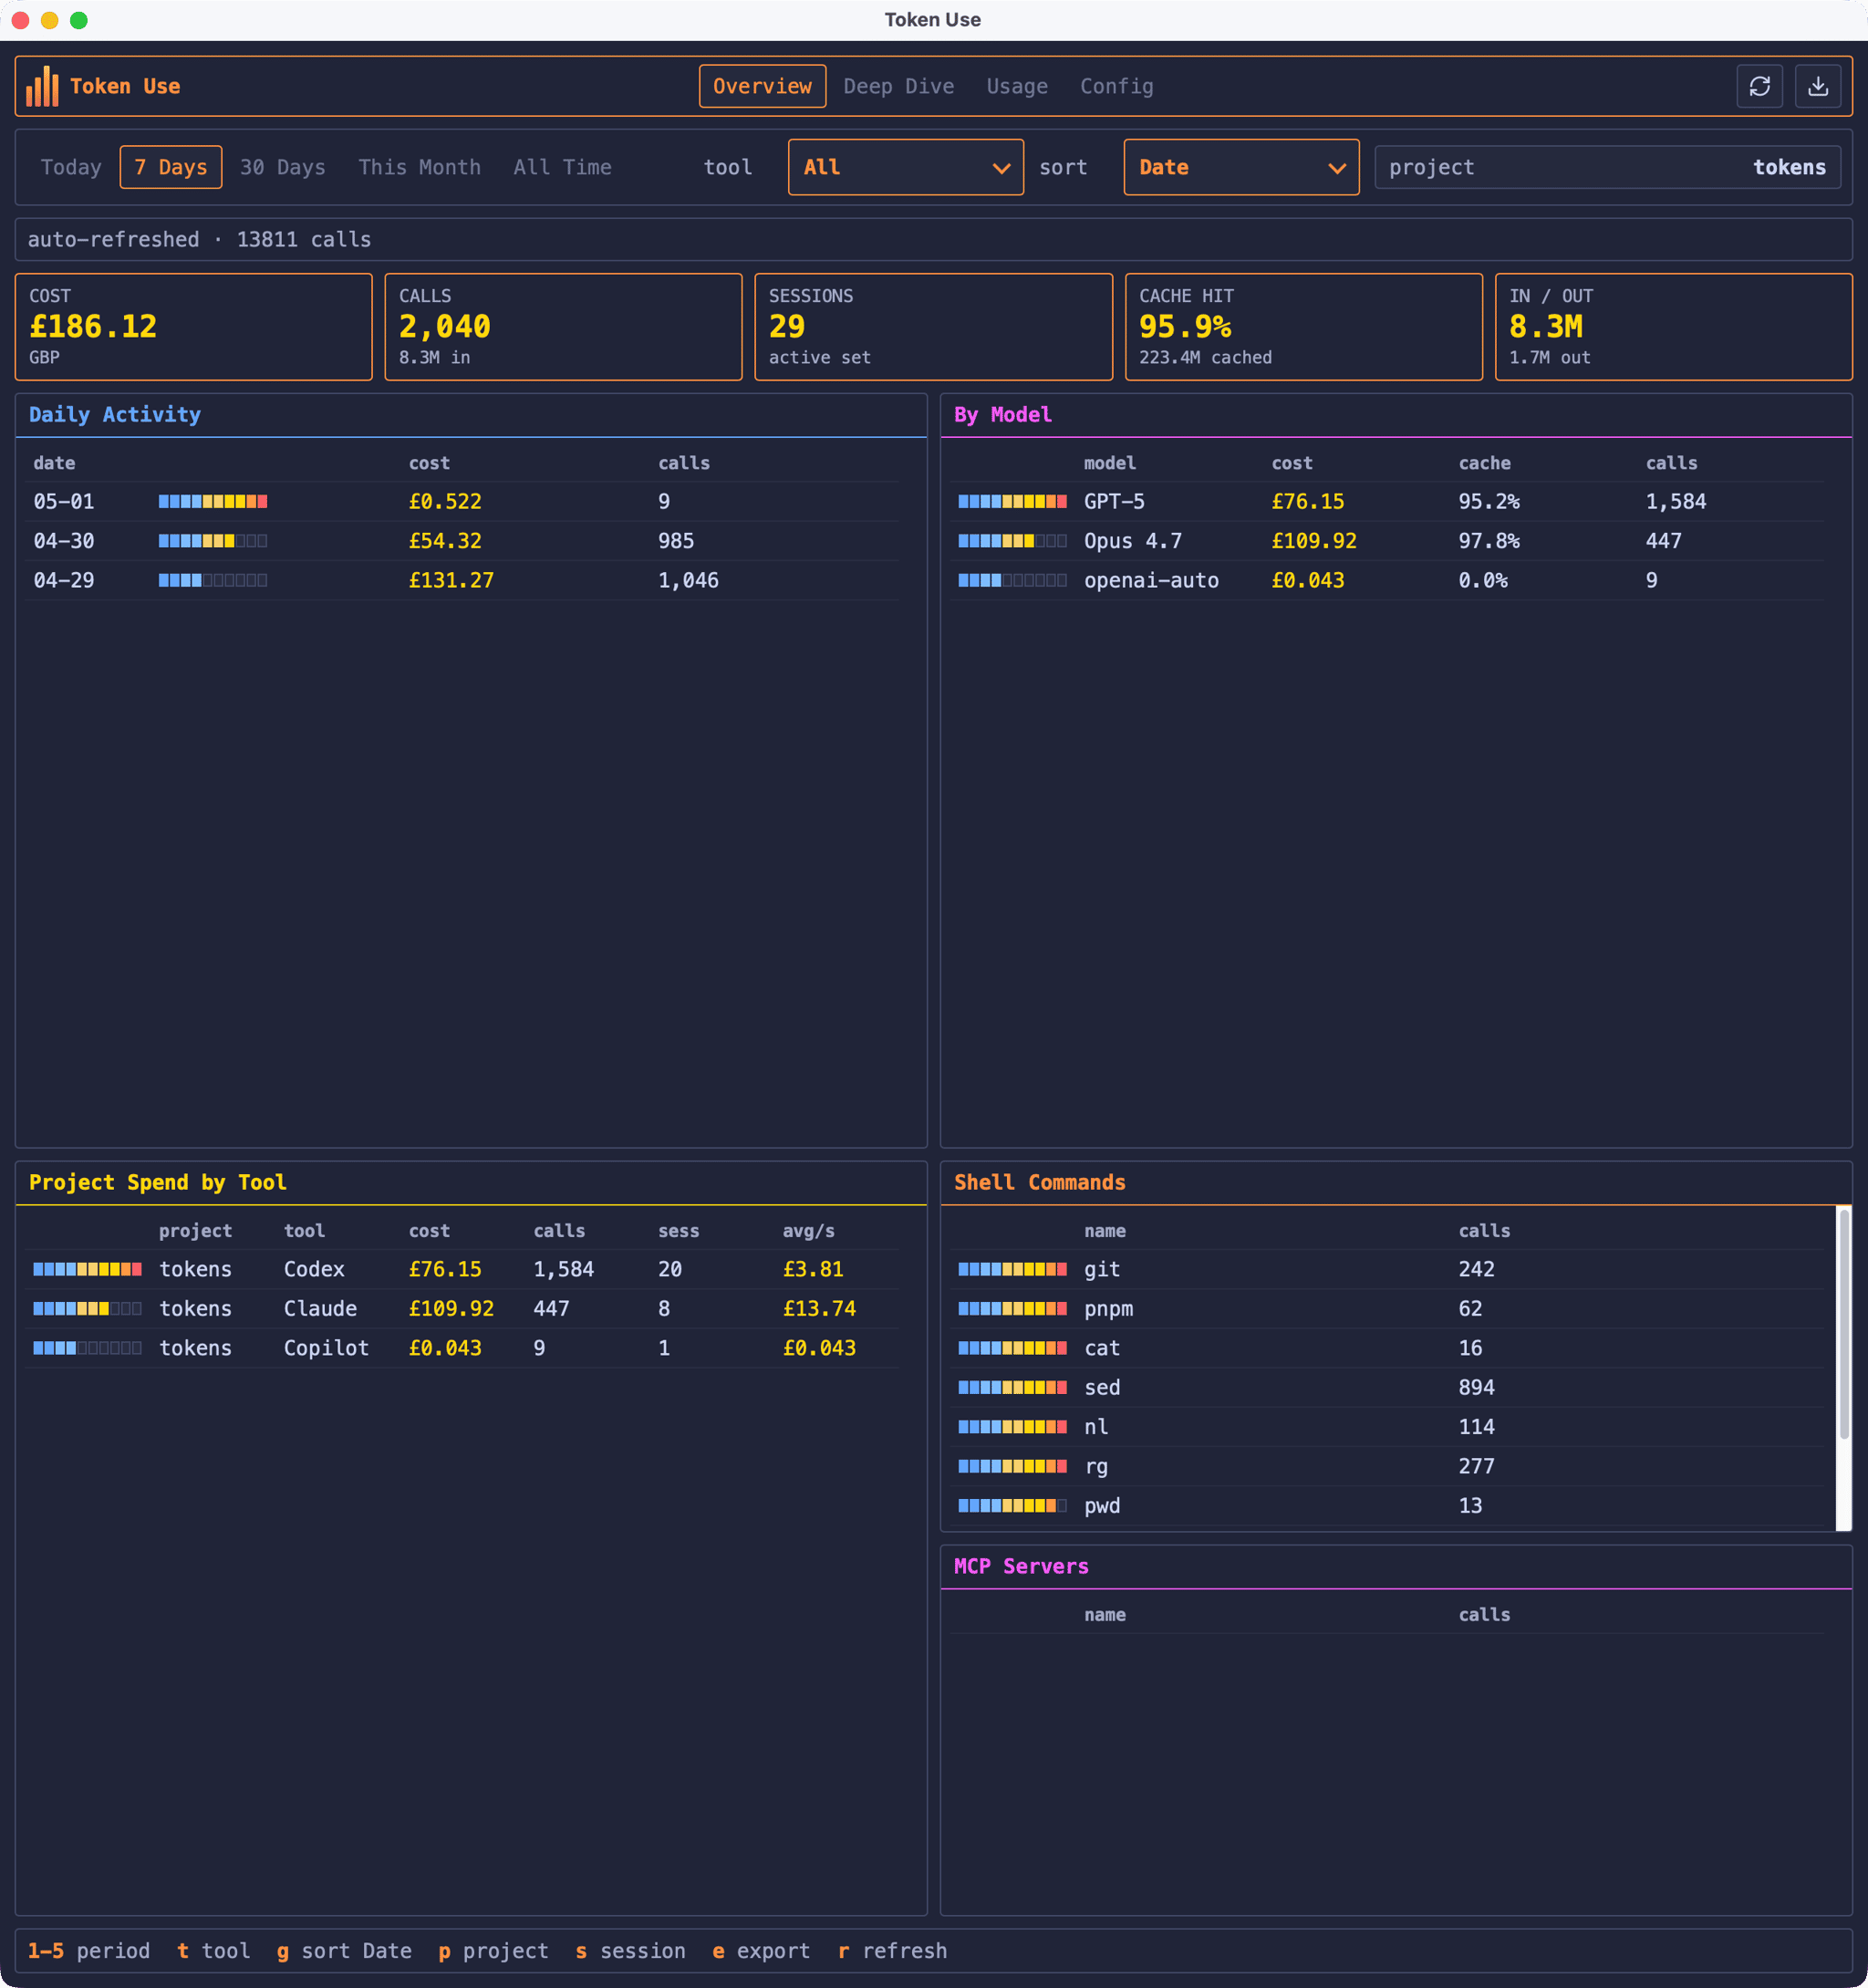
The dashboard above shows the project filtered to tokens (which is the name of the folder on my local machine), with the breakdown split across the tools I used while building it. That 96.3% cache hit rate is doing a lot of the heavy lifting on the Claude Code side. Anthropic prices cache reads at roughly 10% of the input rate, so without that ratio the Claude column would be considerably more eye-watering.
The orange and cyan chart in the middle is the Activity Pulse: the orange bars are spend per bucket, the cyan area is call volume over the same window. Hovering a bucket shows the period label, cost, and call count. Short windows like 24 Hours and 7 Days use hourly buckets; 30 Days and All Time use daily buckets. This Month is a hybrid that stays hourly for the first two weeks and switches to daily from the 15th onward, which avoids the start of a month collapsing into one or two oversized bars.
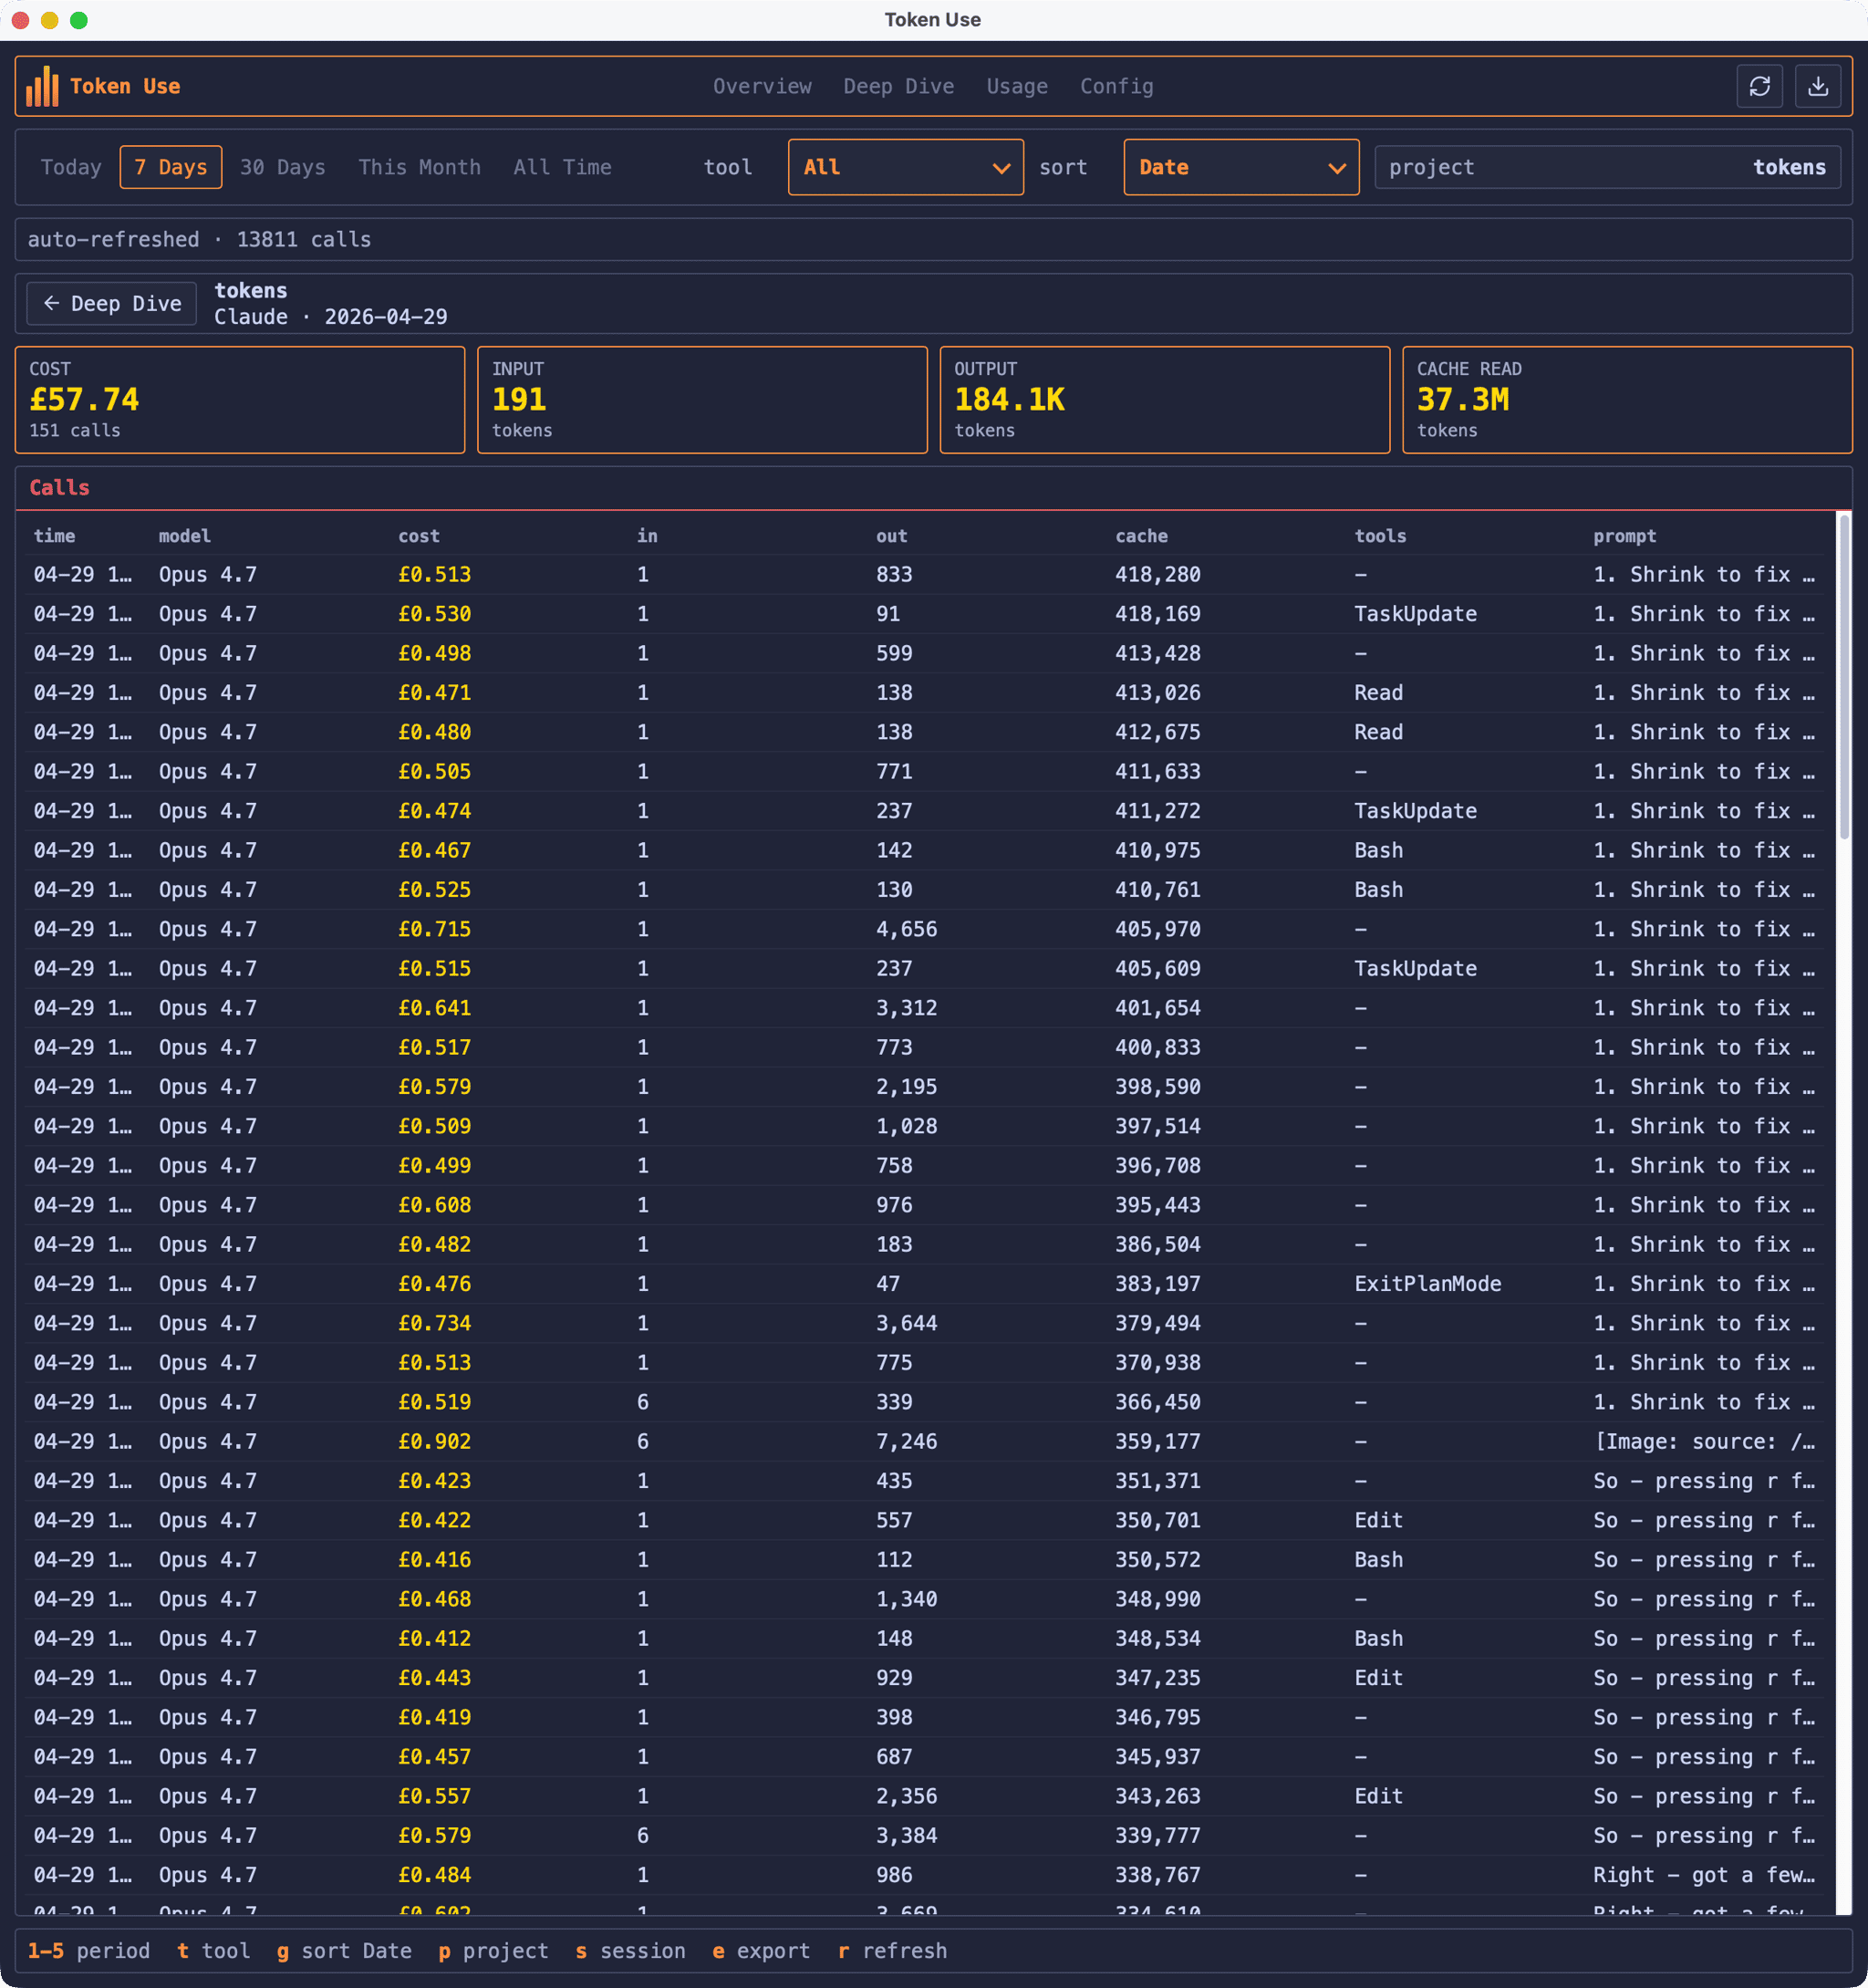
Drilling into a single session shows every call: when it happened, which model handled it, how many tokens went in and out, what tools were used, and the start of the prompt. The Codex session above cost £55.37 across 616 calls, with 86.9M of the 91.4M input tokens served from cache.
I’ll leave the absolute number for the GitHub README (the cover image above isn’t entirely satirical), but seeing it broken down by day, by tool, and by session was the thing that finally convinced me the tool was actually useful rather than just an interesting weekend project.
Installation
macOS
Both the TUI and the desktop app are available through my Homebrew tap:
brew install russmckendrick/tap/tokenusebrew install --cask russmckendrick/tap/tokenuse-desktopopen -a "Token Use"The desktop DMG is Apple Silicon only, signed with a Developer ID Application certificate, and notarised through App Store Connect, so it should open without any Gatekeeper drama.
Linux
The TUI works on AMD64 and ARM64. The script below detects your architecture and grabs the right binary:
ARCH=$(uname -m | sed 's/x86_64/amd64/;s/aarch64/arm64/')curl -sL "https://github.com/russmckendrick/tokenuse/releases/latest/download/tokenuse-linux-${ARCH}" -o tokenusechmod +x tokenusesudo mv tokenuse /usr/local/bin/The desktop app for Linux is published as unsigned AppImage, deb, and rpm assets for both architectures. Verify the matching .sha256 file before running. For the AppImage:
curl -L -O https://github.com/russmckendrick/tokenuse/releases/latest/download/tokenuse-desktop-linux-amd64.AppImagecurl -L -O https://github.com/russmckendrick/tokenuse/releases/latest/download/tokenuse-desktop-linux-amd64.AppImage.sha256sha256sum -c tokenuse-desktop-linux-amd64.AppImage.sha256chmod +x tokenuse-desktop-linux-amd64.AppImage./tokenuse-desktop-linux-amd64.AppImageAppImage installs can check for newer desktop releases from the Config tab. If you used the .deb or .rpm package, update manually with the matching asset from GitHub Releases.
Windows
The Windows TUI is a single executable:
Invoke-WebRequest -Uri "https://github.com/russmckendrick/tokenuse/releases/latest/download/tokenuse-windows-amd64.exe" -OutFile "tokenuse.exe"The desktop app ships as both an NSIS installer and an MSI for environments that prefer Windows Installer. Both are unsigned for now, so verify the .sha256 before installing:
Invoke-WebRequest -Uri "https://github.com/russmckendrick/tokenuse/releases/latest/download/tokenuse-desktop-windows-amd64-setup.exe" -OutFile "tokenuse-setup.exe"Get-FileHash .\tokenuse-setup.exe -Algorithm SHA256Start-Process .\tokenuse-setup.exeLike the AppImage build, the installed Windows desktop app can check for later NSIS installer releases from the Config tab. All releases are on the GitHub releases page.
The TUI
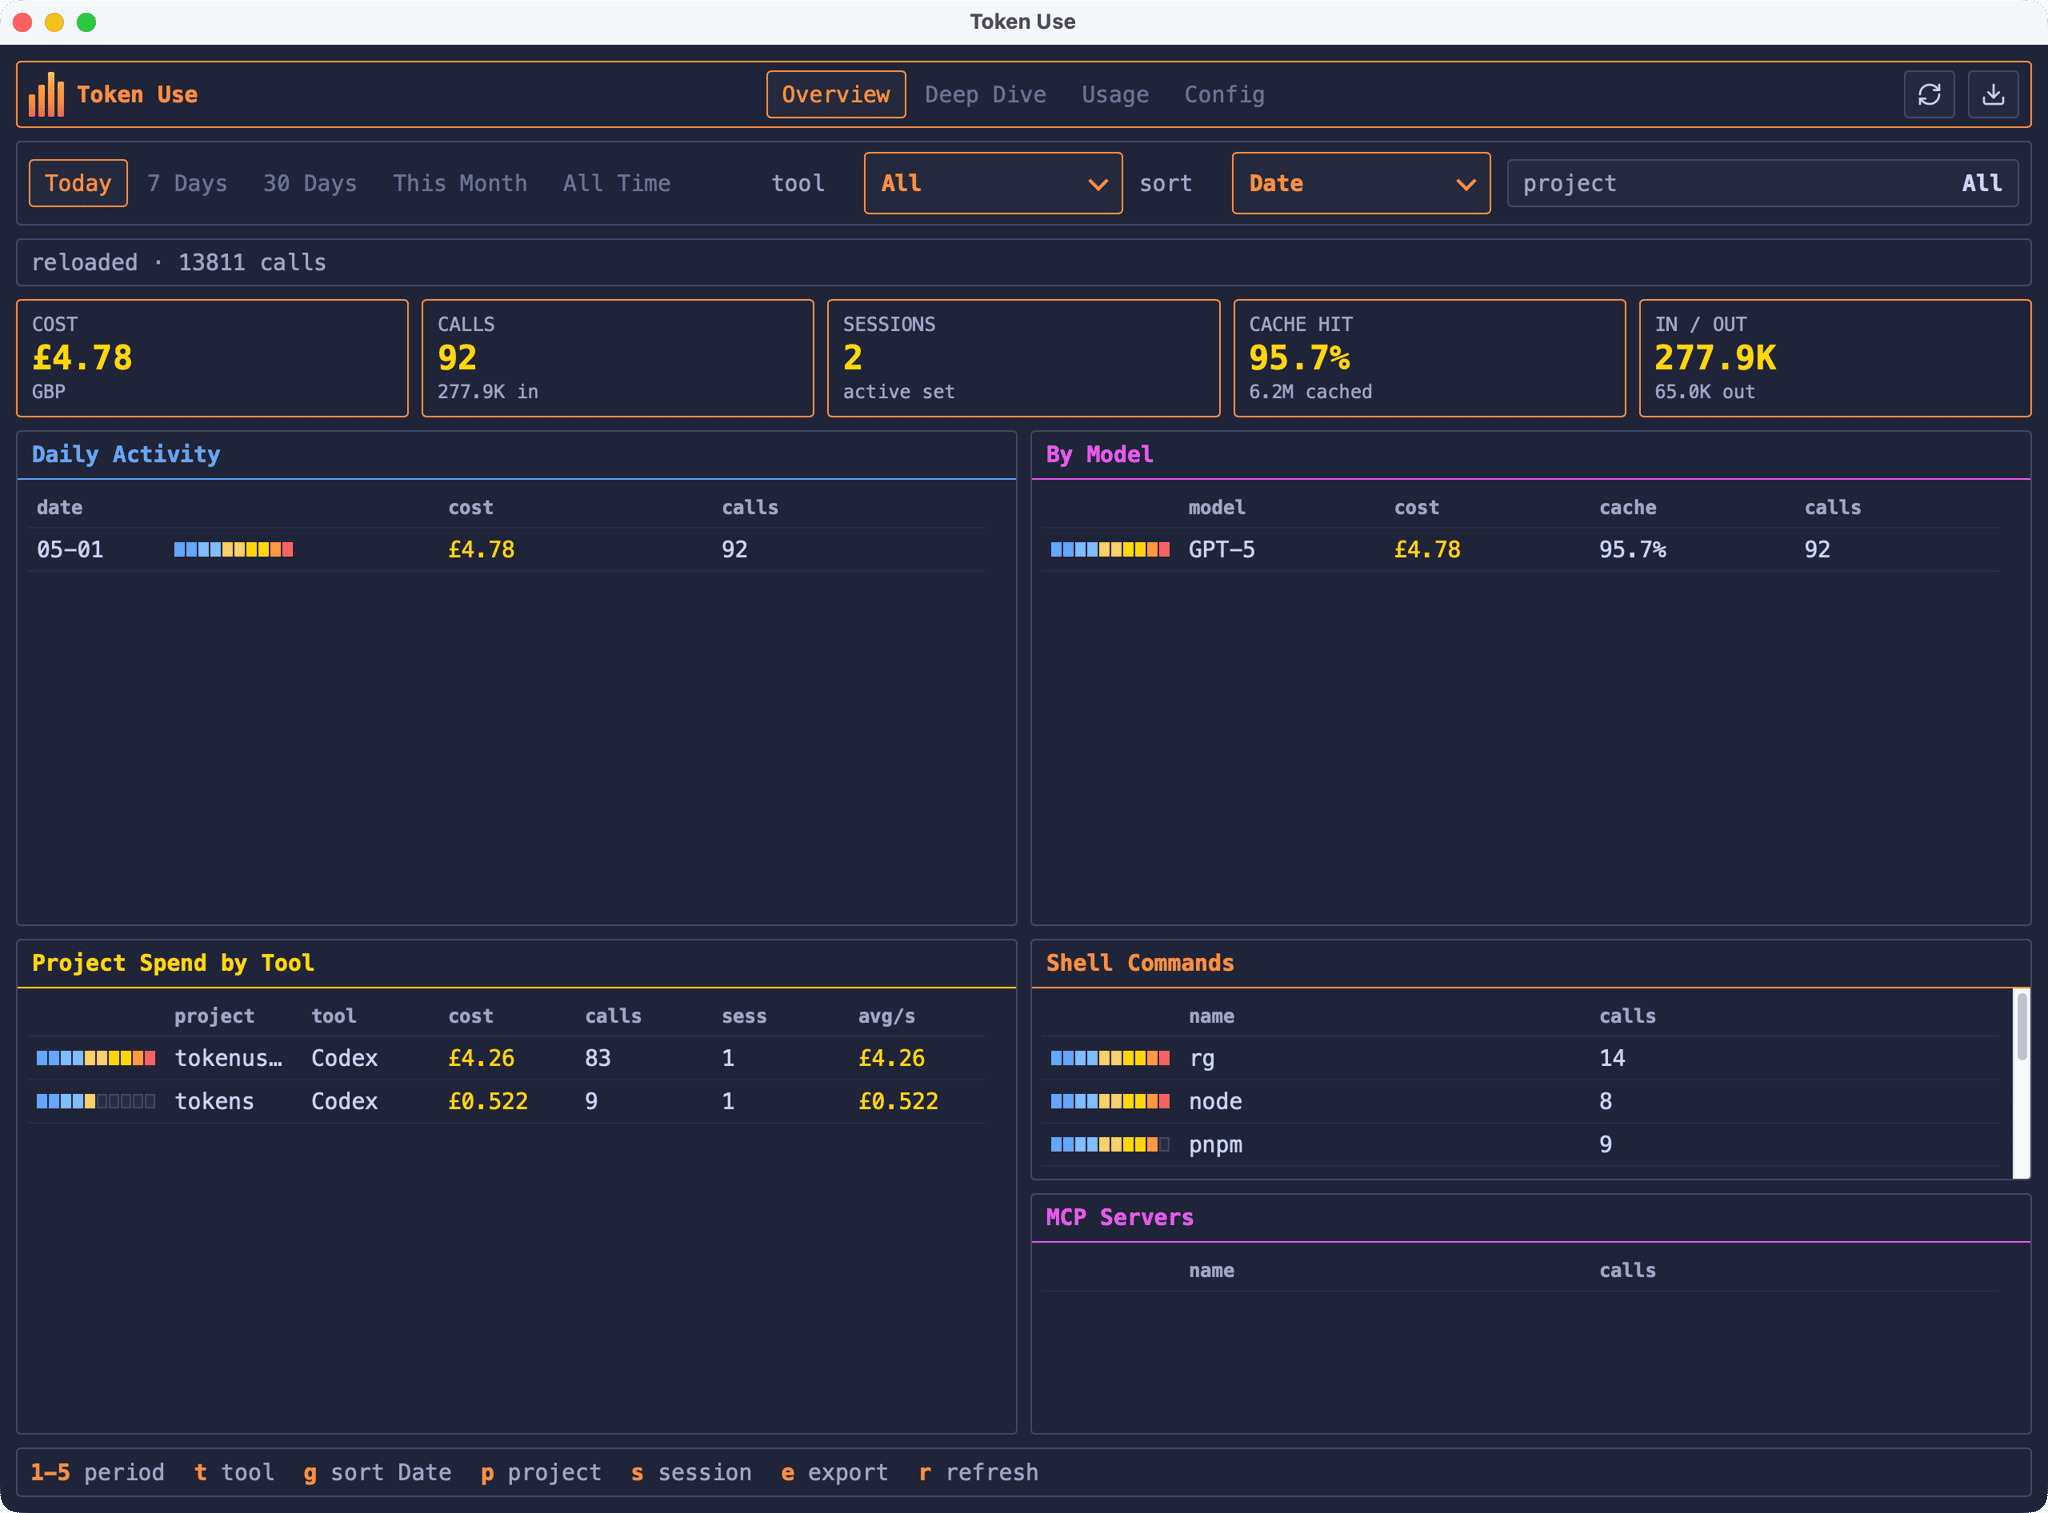
Run tokenuse and it’ll scan your local session files, build the archive, and drop you into the Overview page:
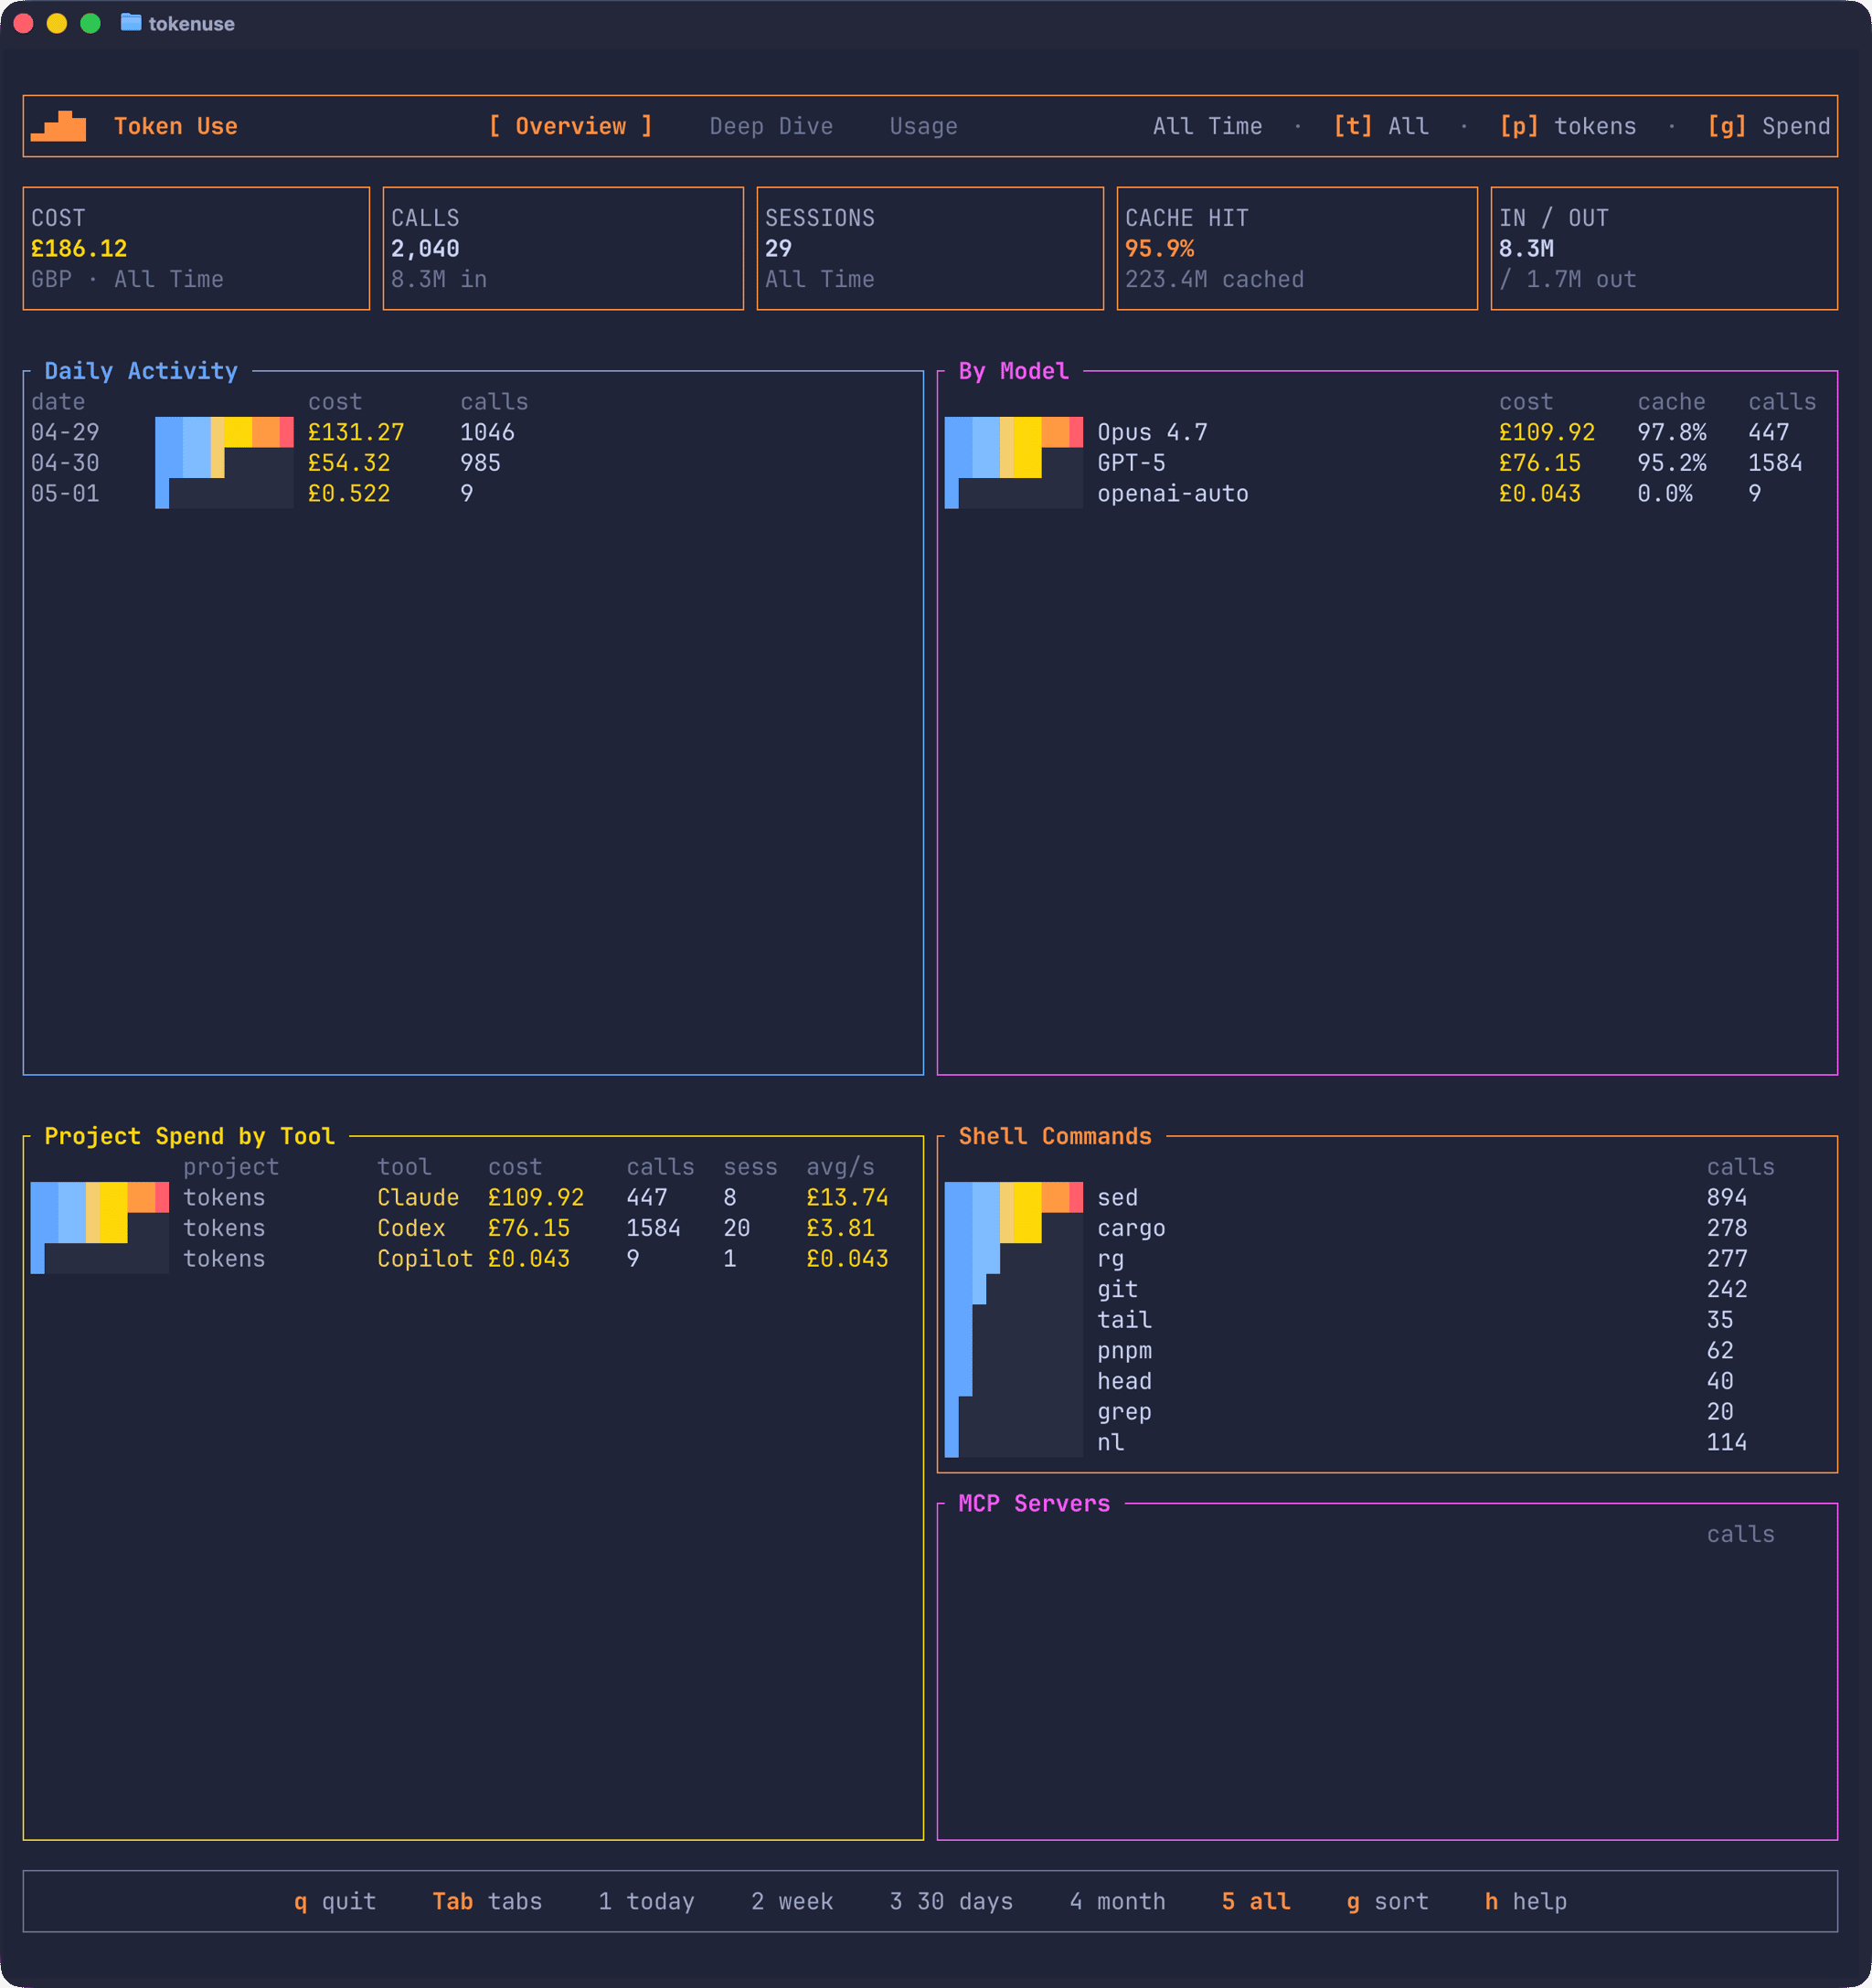
The summary tiles up top cover cost, calls, sessions, cache hit rate, and input/output token totals. Below that, the Activity Pulse is chronological and ignores whatever sort mode you’ve picked, so the line keeps showing usage over time even when the ranked tables underneath are sorted by spend, latest date, or token use. The ranked tables themselves cover project and project/tool spend, model spend, shell commands, and MCP servers.
The filters work the way you’d expect:
| Key | Action |
|---|---|
1 – 5 | Period: rolling 24 hours, 7 days, 30 days, this month, all time |
t | Cycle the tool filter |
p | Open the project picker |
s | Open the session picker |
g | Cycle sort mode: spend, latest date, token use |
Tab / Shift-Tab | Cycle between Overview, Deep Dive, and Usage |
Shift-D | Toggle between live and bundled sample data |
r | Resync the archive |
e | Generate a report |
q | Quit |
The 1 period is rolling from the current time rather than a calendar-day midnight cutoff, which I find more useful when you’ve just finished a session and want to see what it actually cost.
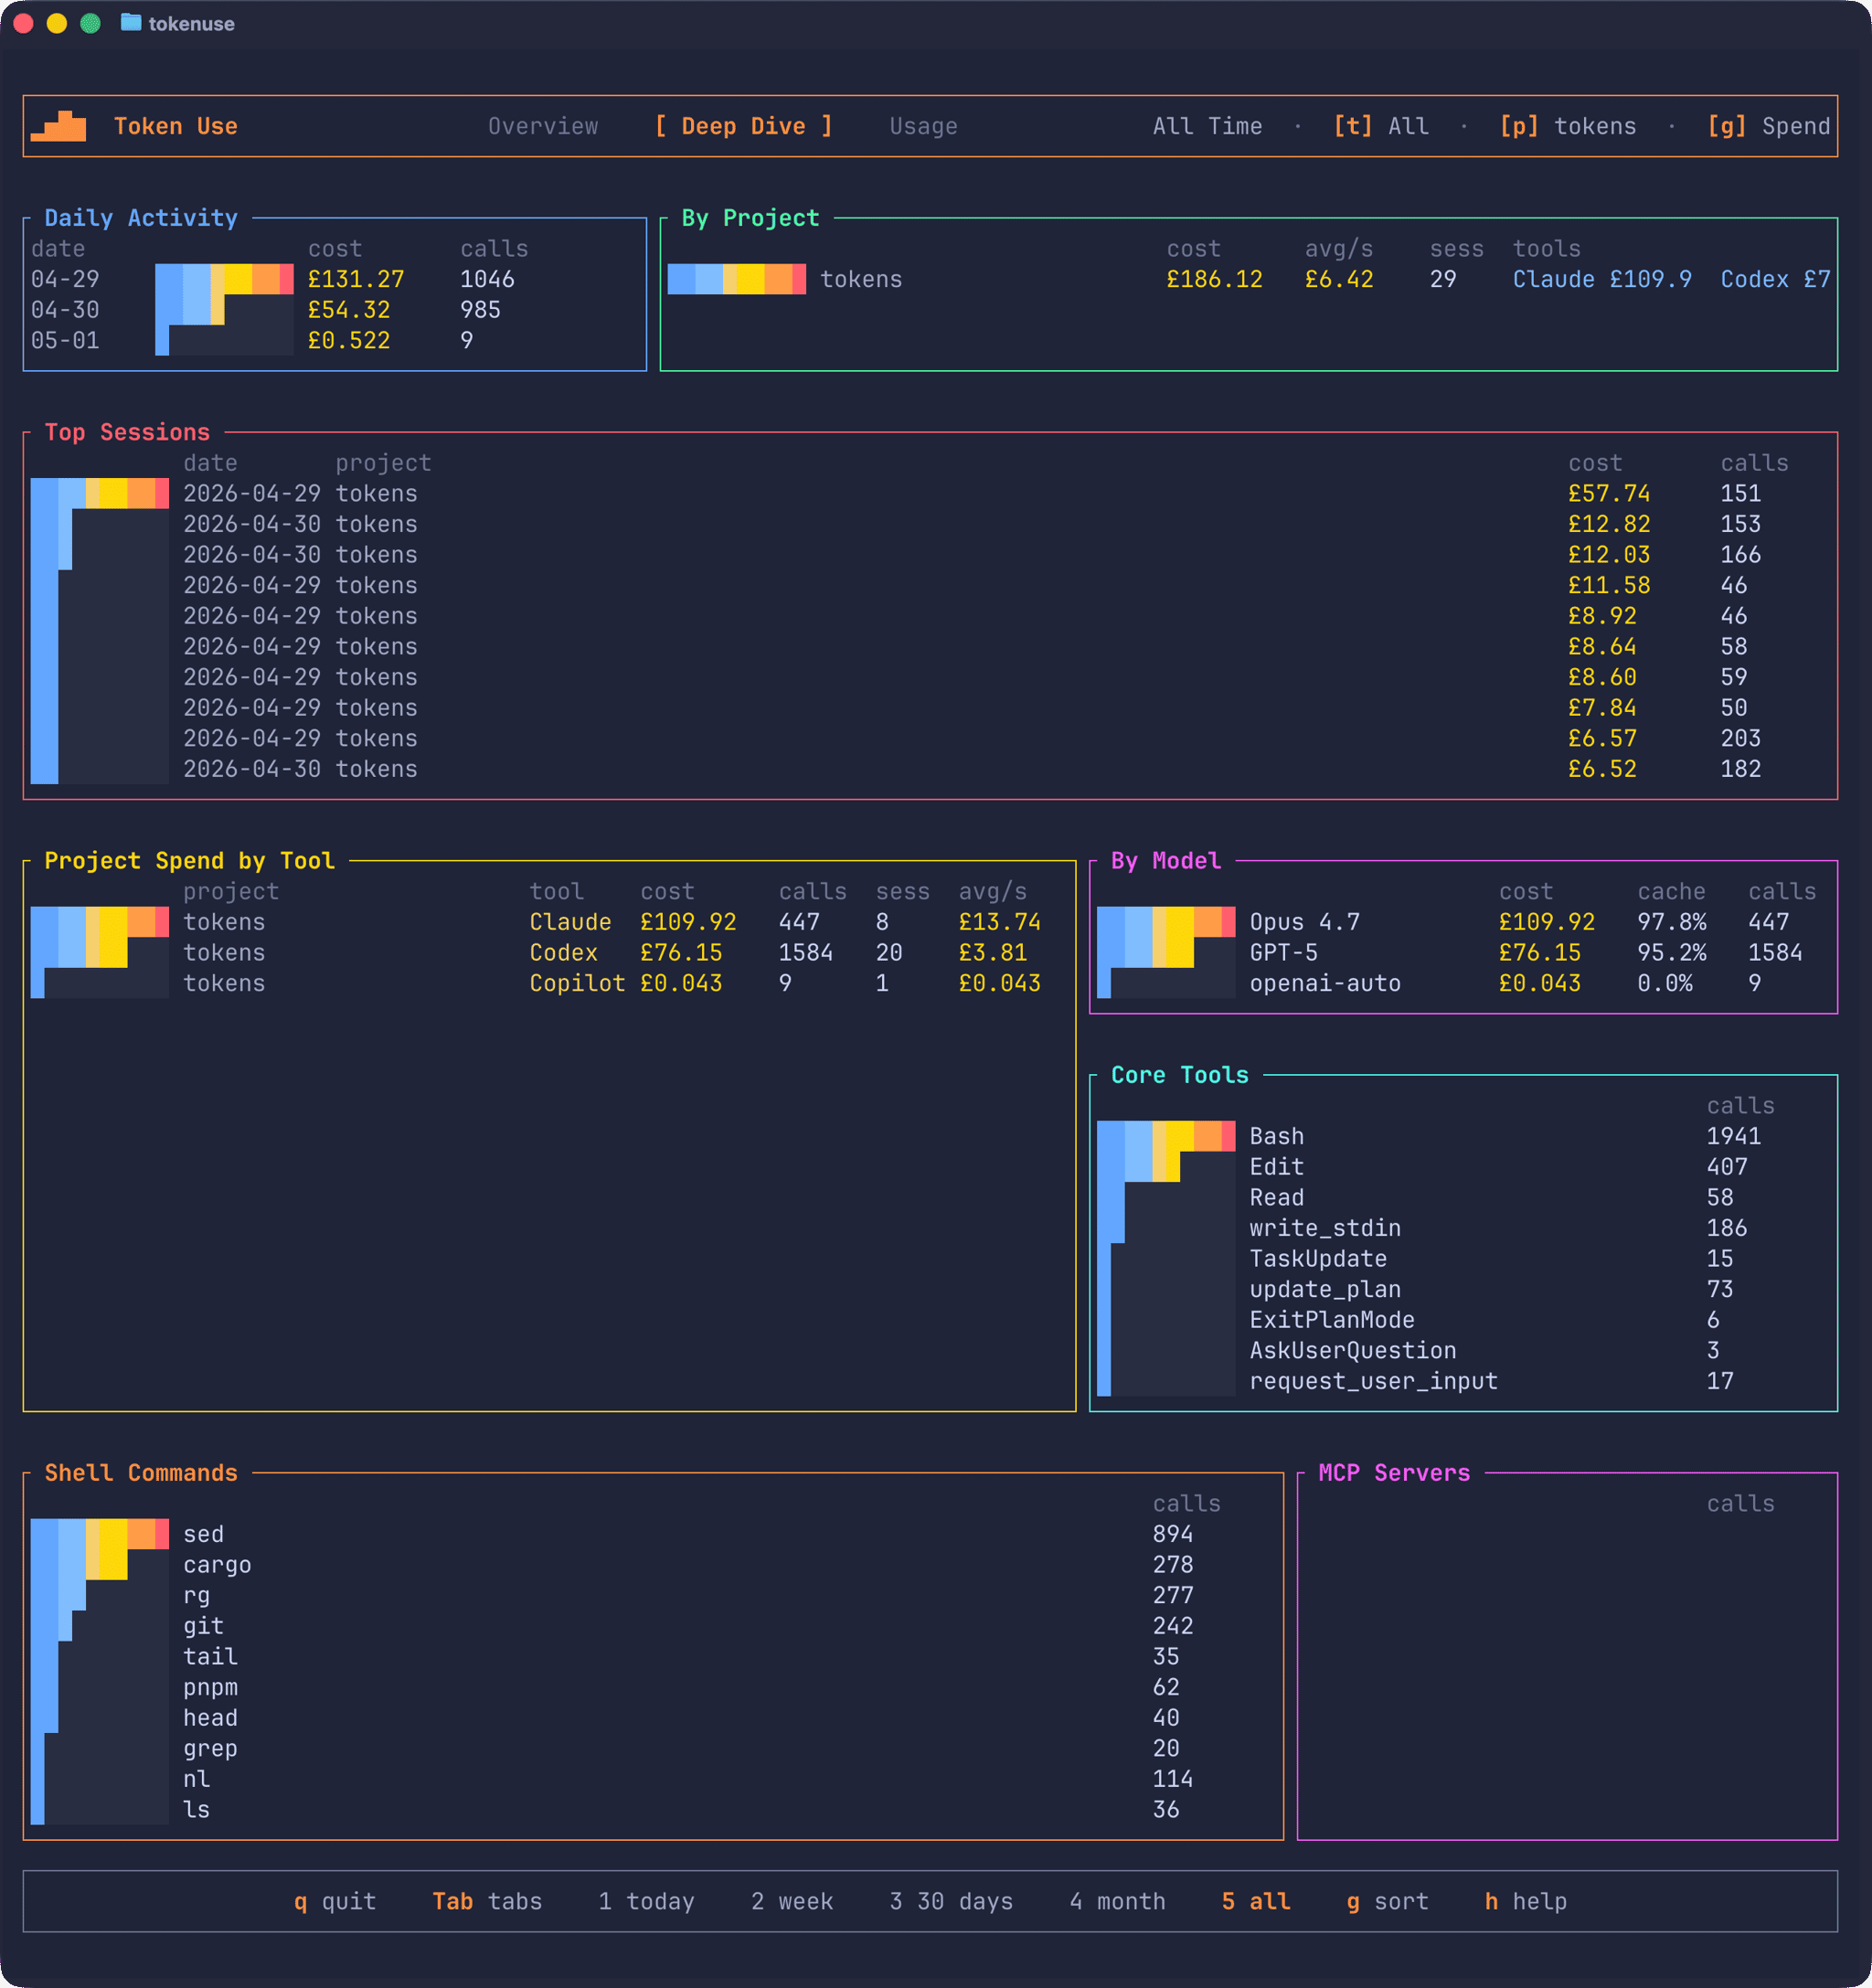
The Deep Dive page swaps the compact Activity Pulse for a larger Activity Trend graph, and adds two panels that aren’t on Overview: Top Sessions, ranking the most expensive sessions in the active filter, and Core Tools, which counts every AI tool call (Bash, Edit, Read, update_plan, and so on).
Sessions and call detail
The session page is the bit I find myself in most often. Press s to open a searchable picker of every session in the active filter; start typing to narrow it down by date, tool, or project name:
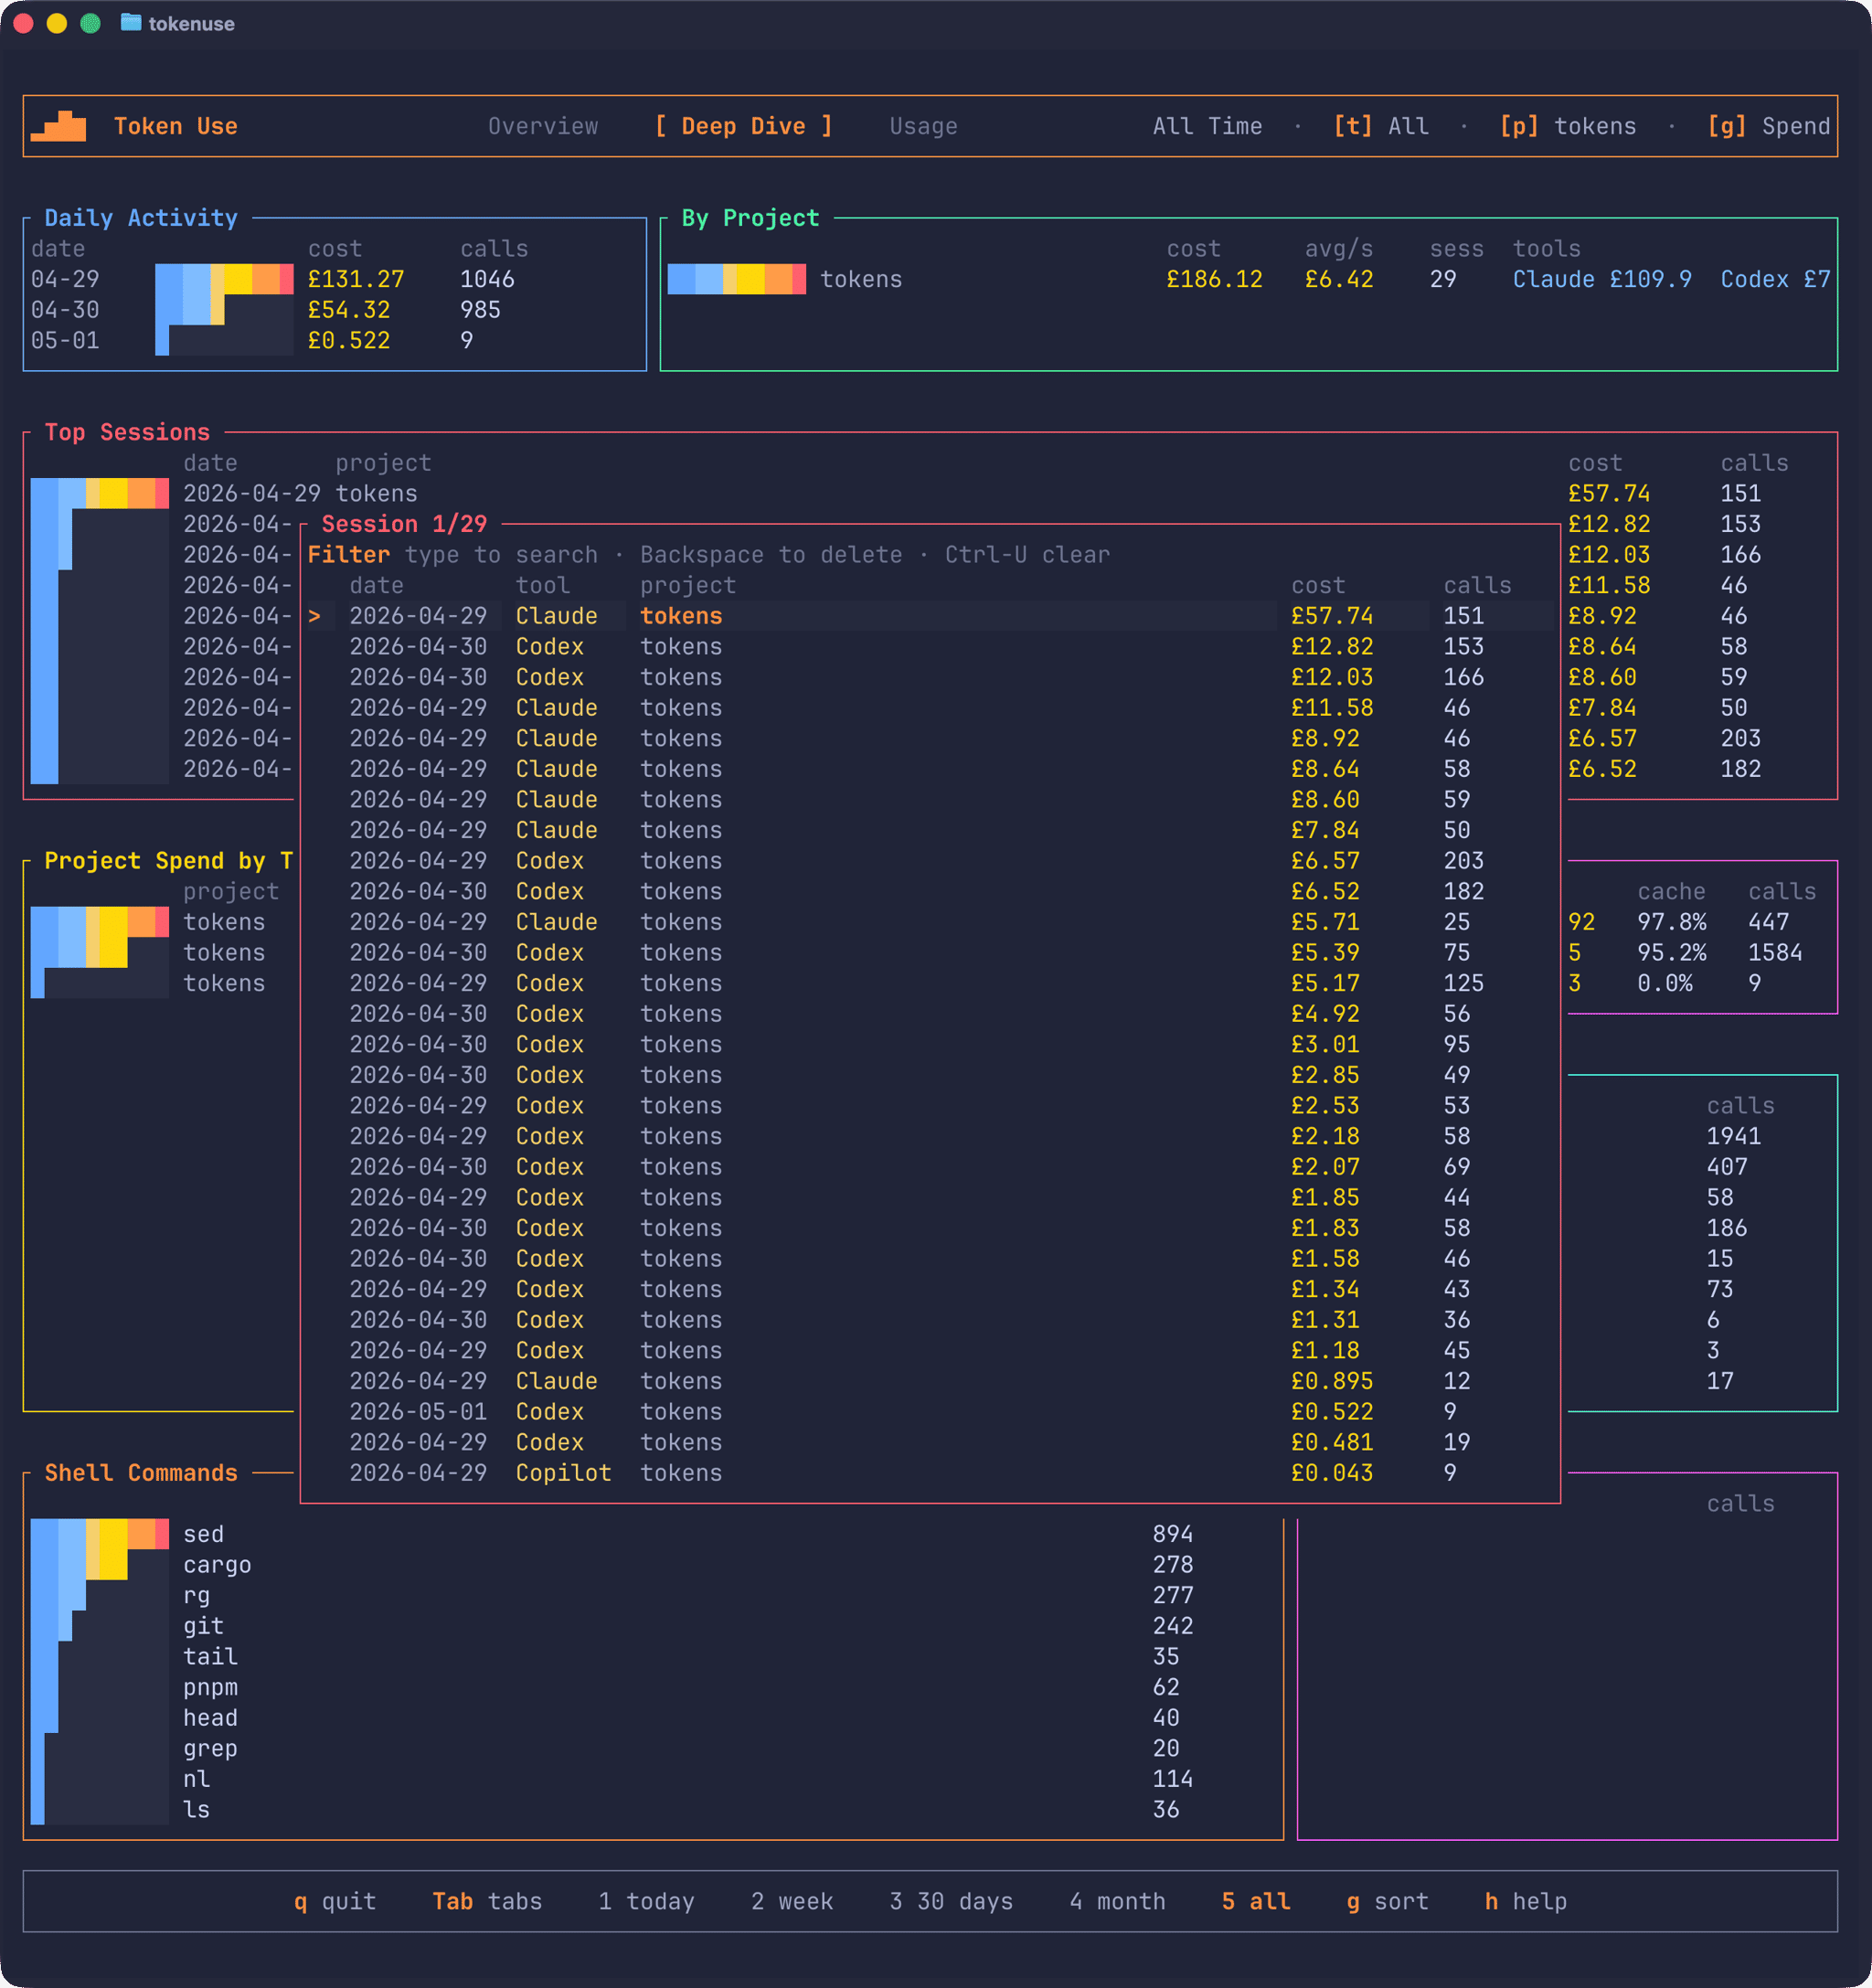
Pick one and the drill-down opens, showing every turn in the session along with its timestamp, model, cost, tokens, tools, and the start of the prompt:
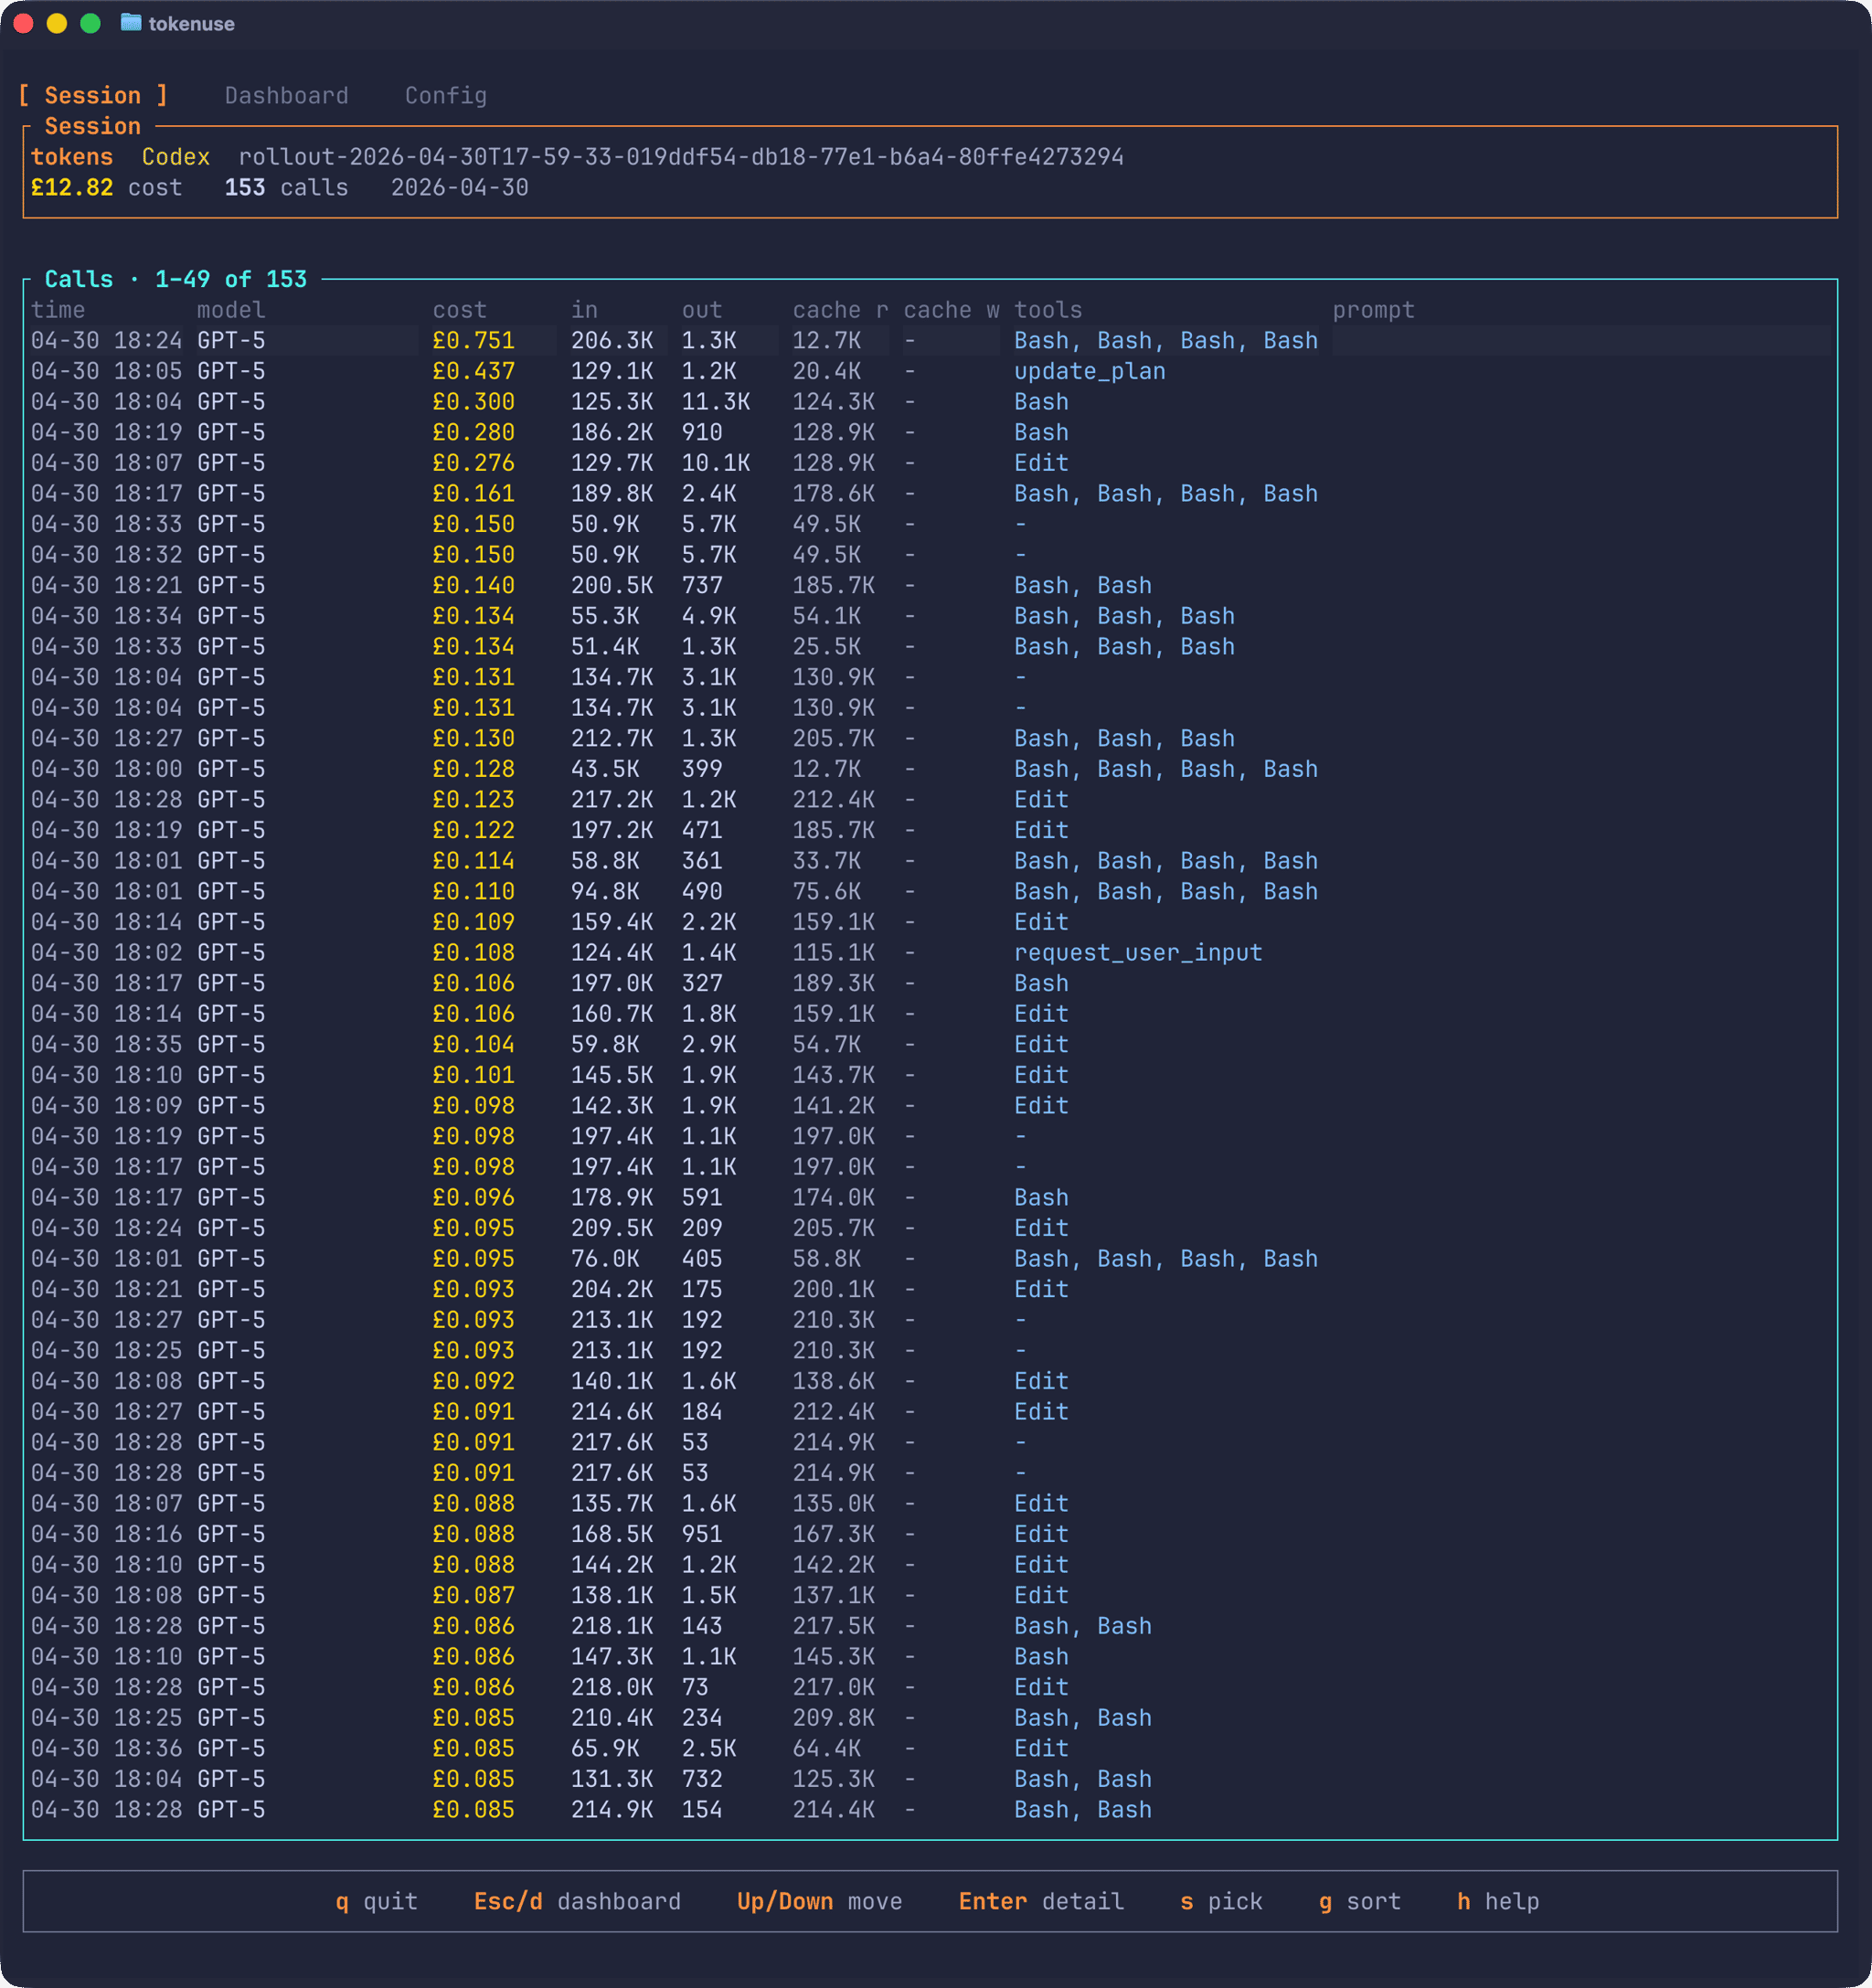
Pressing Enter on any row opens a detail modal with the full stored prompt and metadata for that turn. It’s useful for tracking down which question produced the expensive answer.
Usage and rate limits
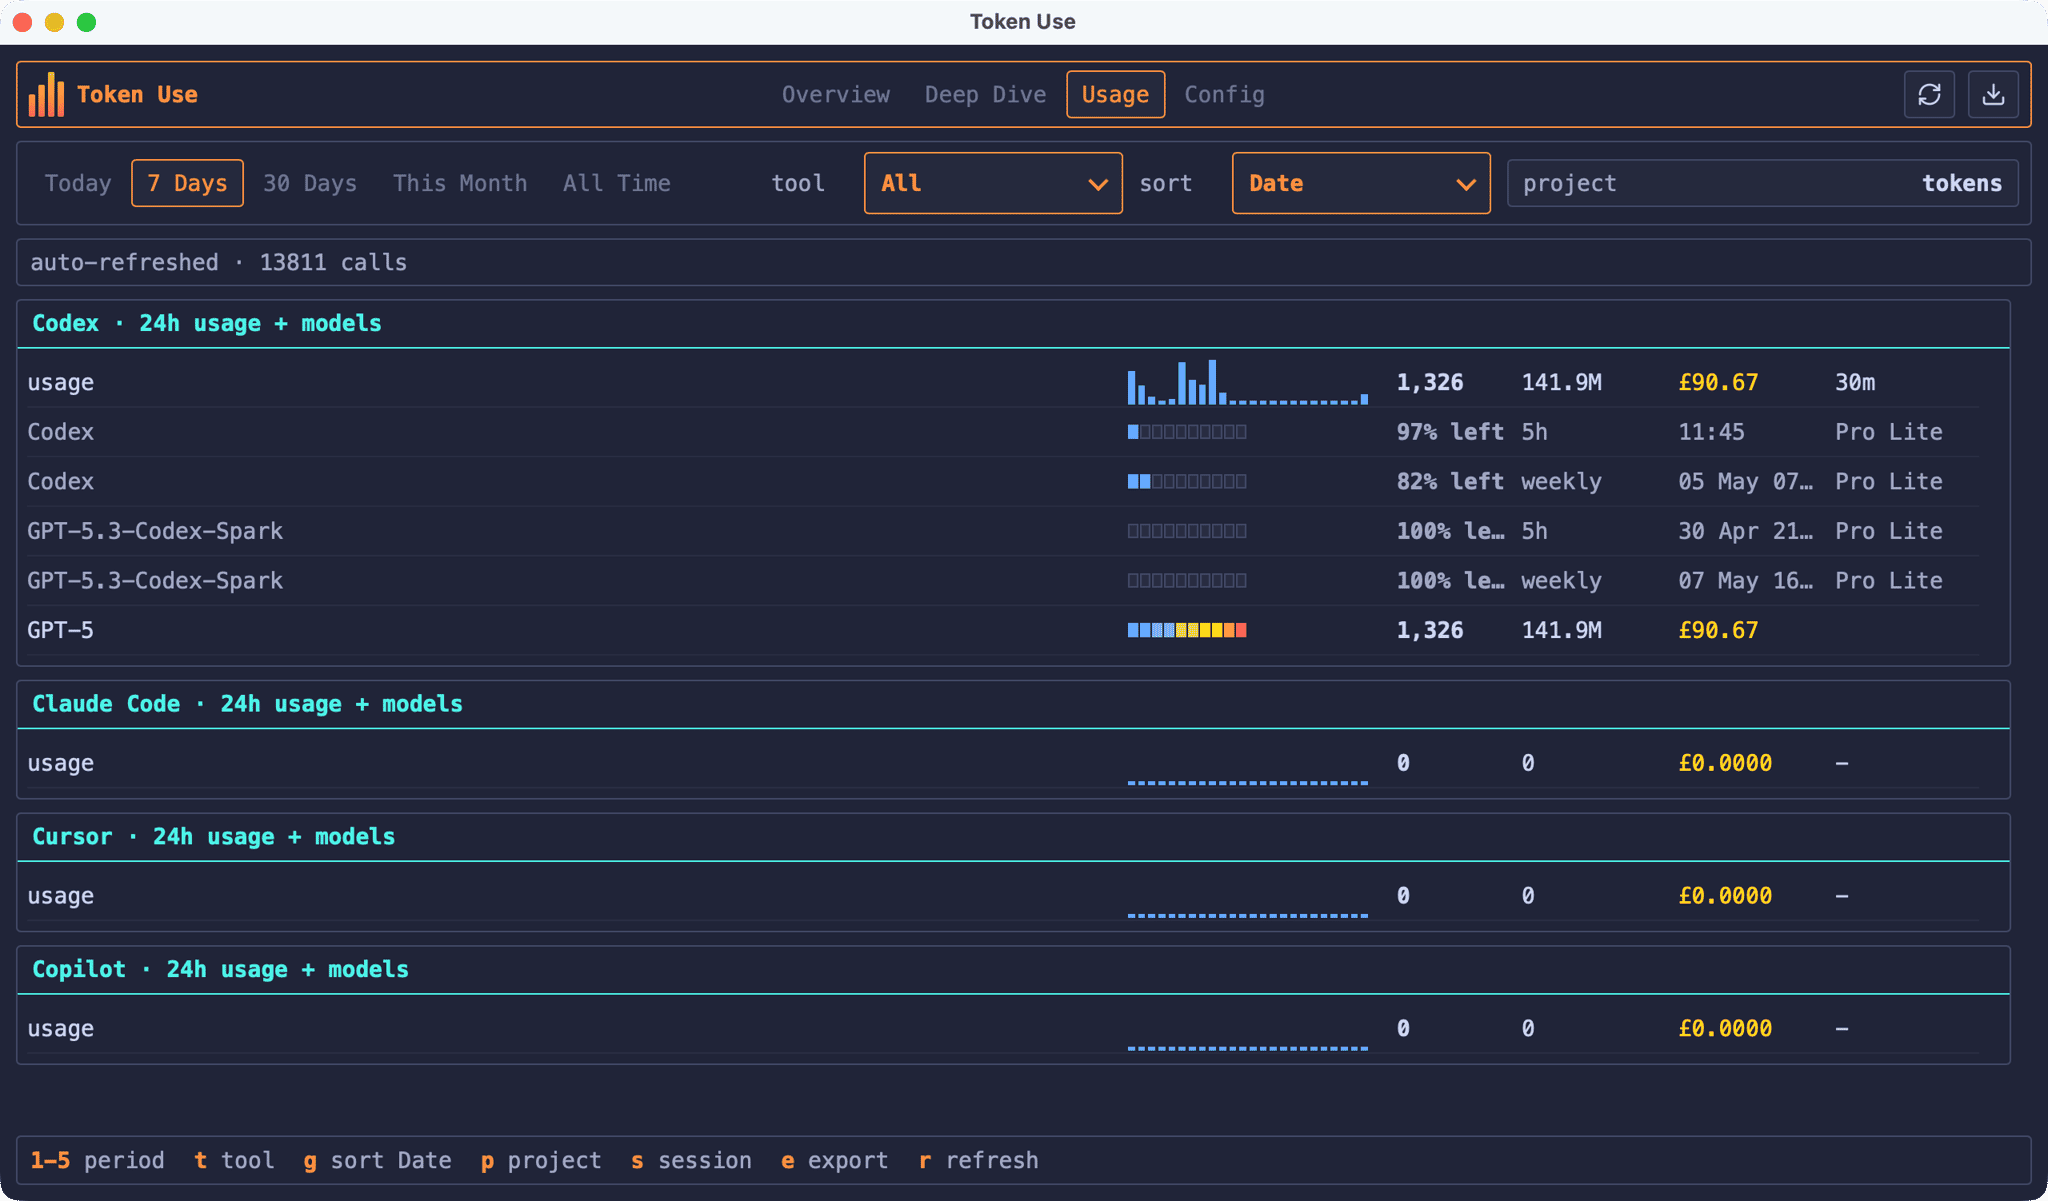
The Usage page is a rolling 24-hour view across every supported tool. Opening the page automatically selects the 24 Hours period so the visible filter matches what each per-tool console is showing, and the page ignores the project filter so each tool gets its own section regardless of where you’ve been working.
Each tool console shows a 24-hour pulse graph, totals for calls, tokens, cost, and last seen, plus the top three models for that tool’s slice. If you’re using Codex, the Usage page also shows the rate-limit snapshots Codex writes to its session files, so you can see how close you are to the 5-hour and weekly windows without having to do the maths yourself:
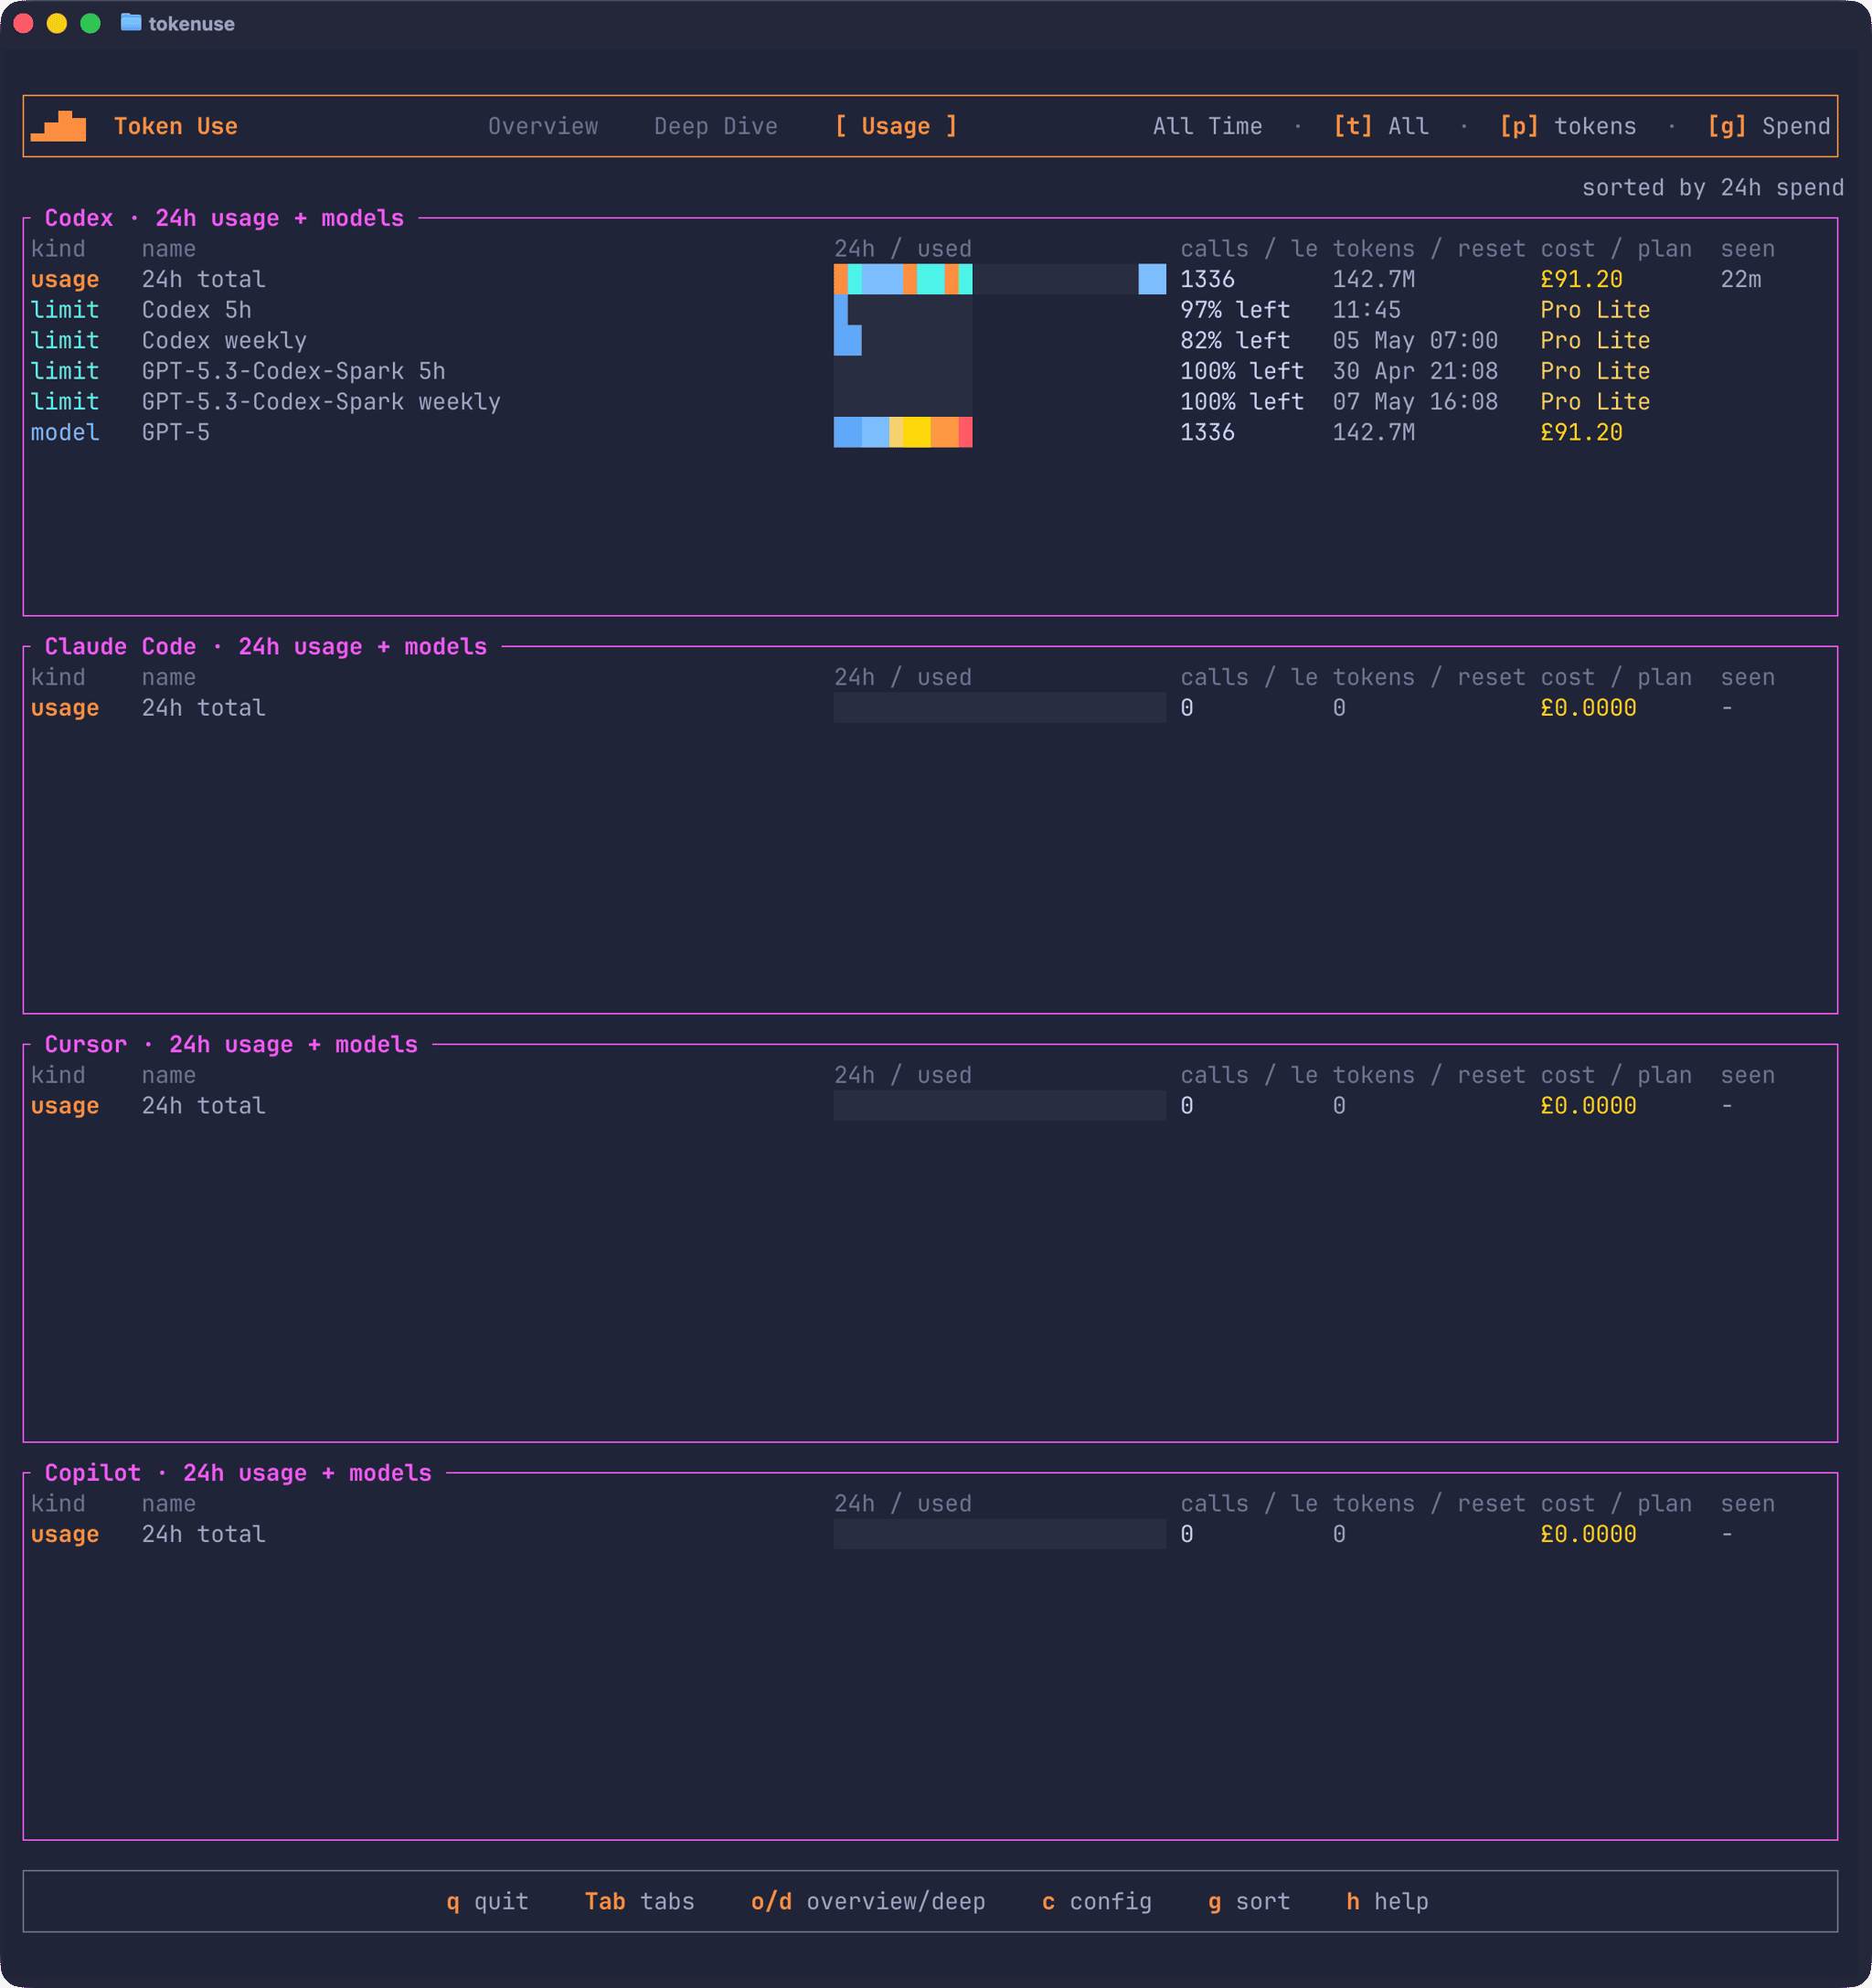
Token Use doesn’t make any live API calls to fetch limits, it just surfaces the values your tools have already written locally. That’s a deliberate trade-off: the figures lag slightly behind whatever the tool is showing in real time, but there’s no extra surface area to worry about.
Currency and pricing
Costs are calculated and stored as USD at import time, then converted for display. The Config page lets you pick a different display currency:
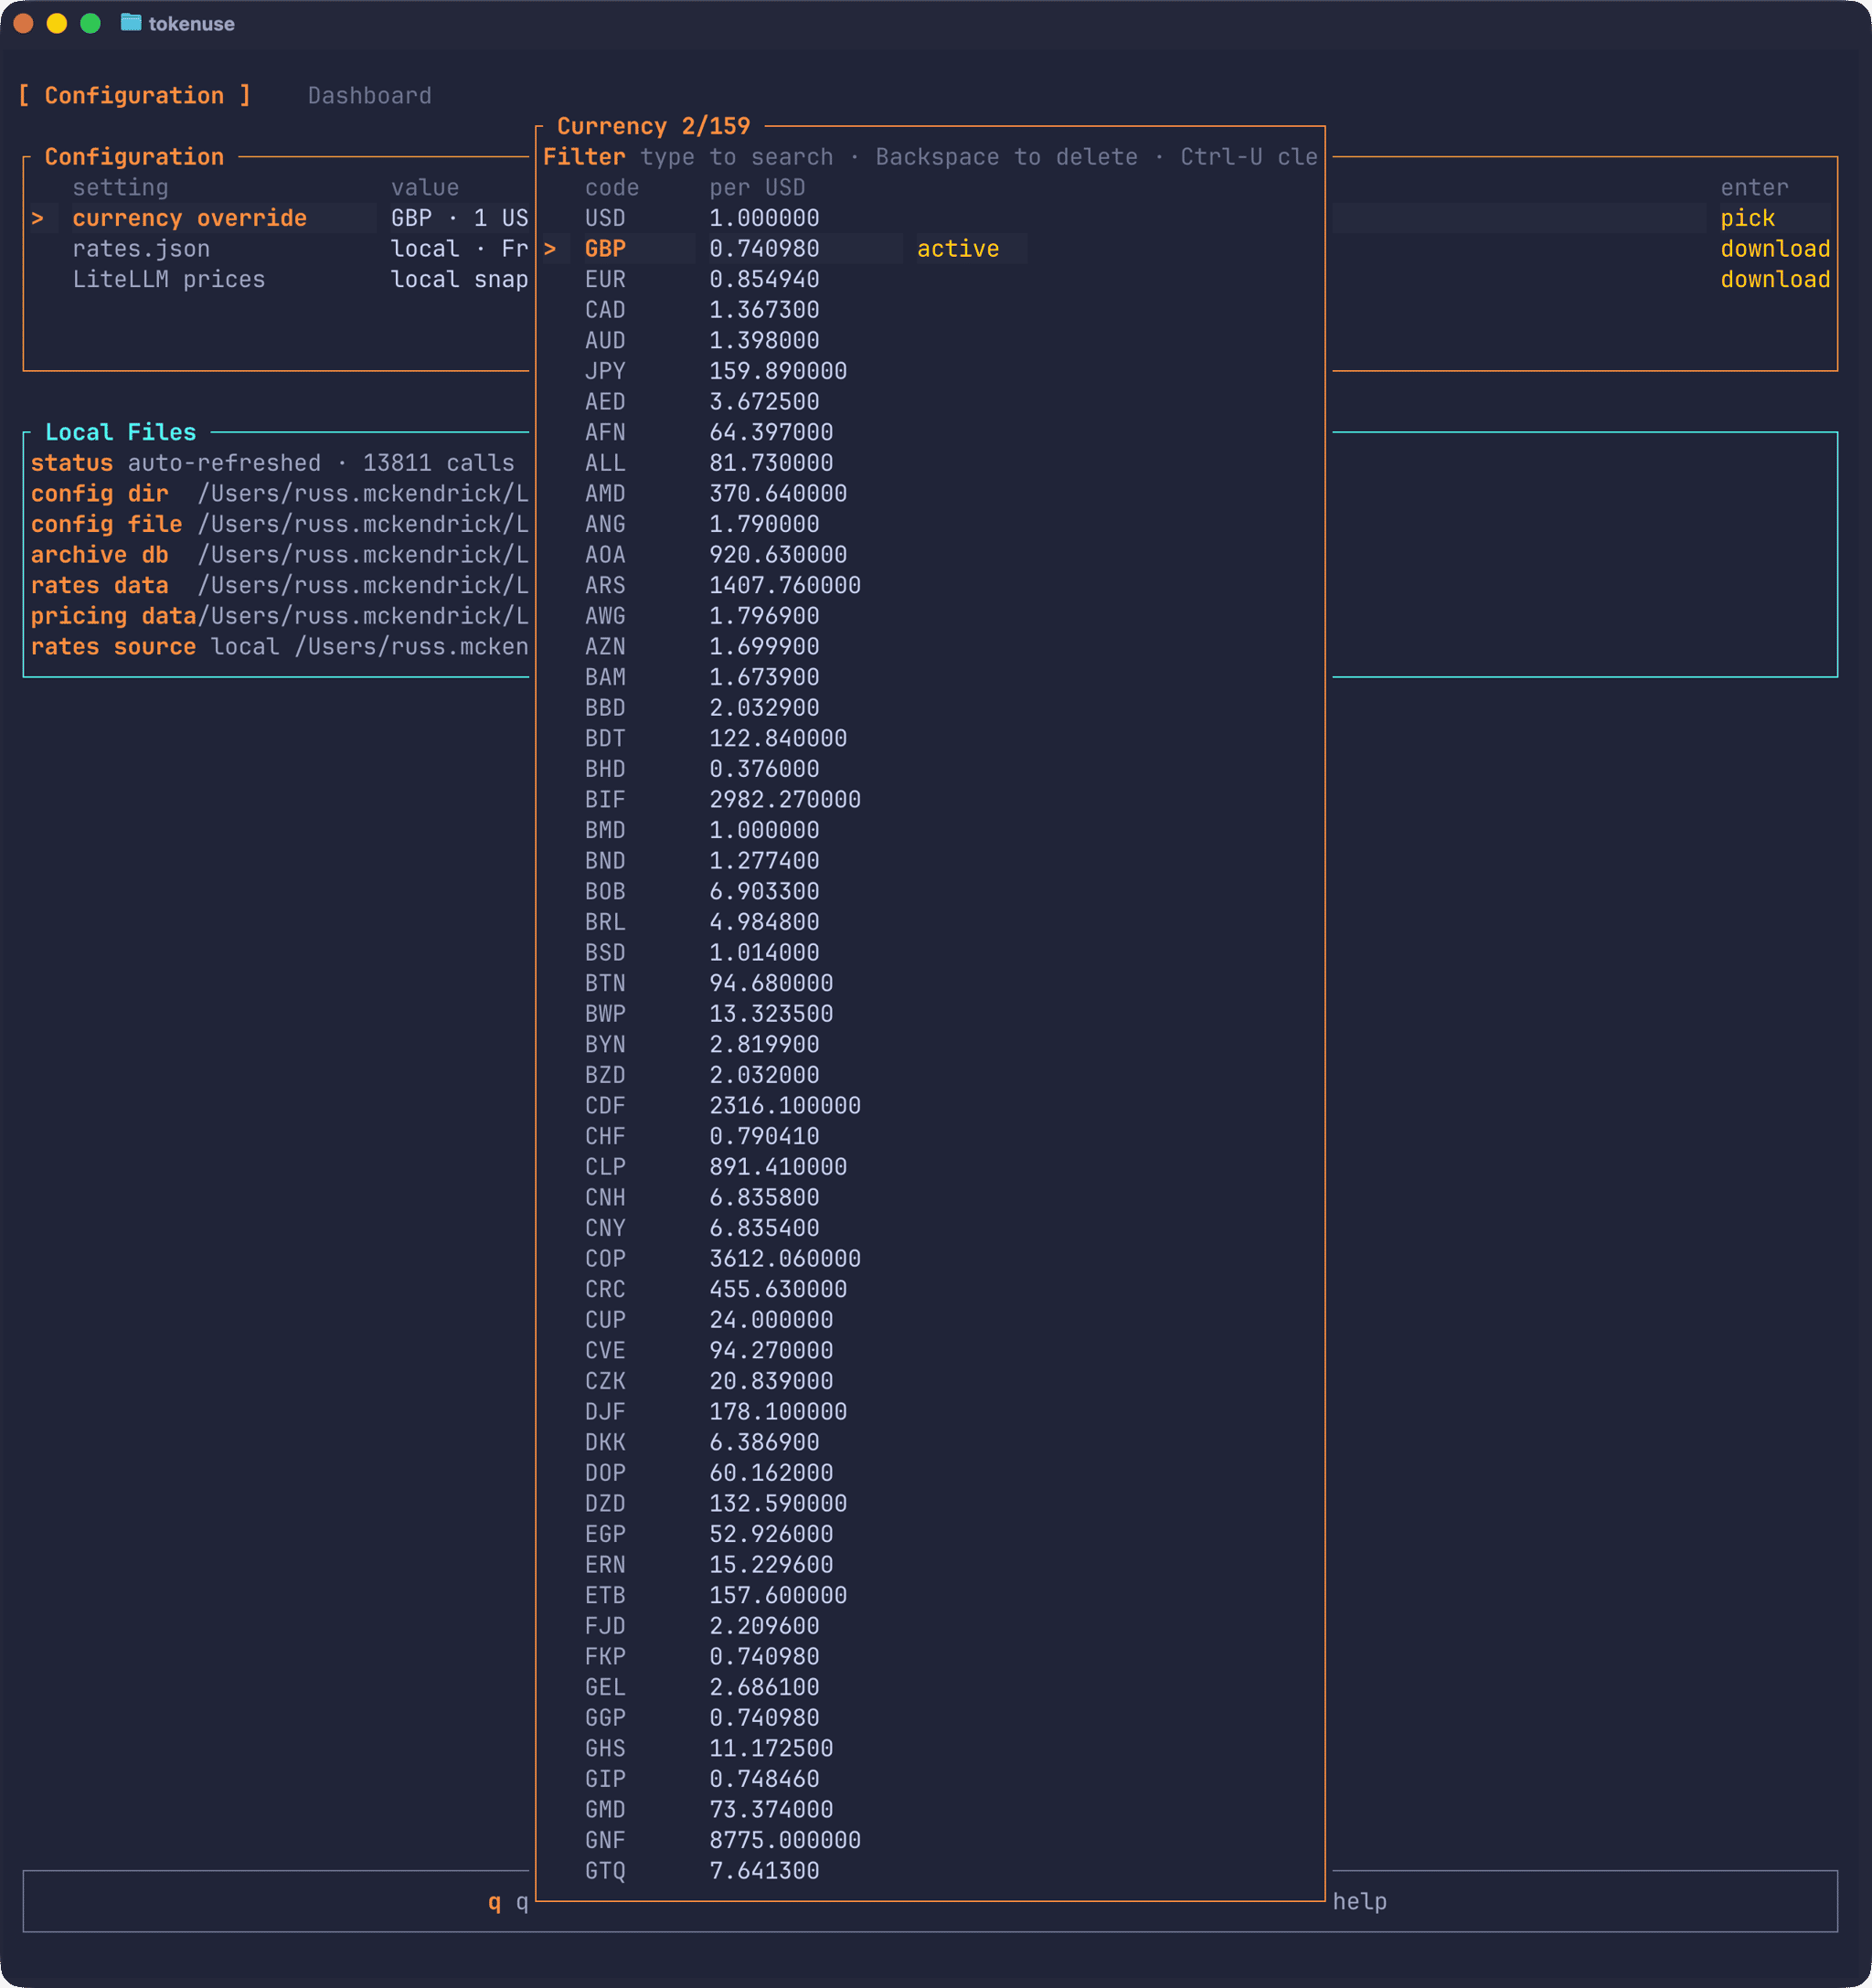
The currency snapshot is fetched from Frankfurter and the pricing table is derived from LiteLLM. Both are embedded in the binary so the tool works completely offline by default. If you want fresher rates, the Config page has explicit “download latest” buttons that need confirmation each time. There are no background fetches.
The Config page also has a clear-data action that asks for confirmation, deletes the local archive.db, and immediately reimports from your tool history. Your config, downloaded rates, pricing snapshots, and previously generated reports are kept. It’s handy if you want to rebuild the archive against a fresher pricing snapshot, or just to check the importer is doing what you expect.
The desktop app
The desktop app is a Tauri v2 + Svelte frontend over the same Rust core. It reads the same archive, writes the same config, and exposes the same dashboard pages, with clickable tabs and dropdowns alongside the keyboard shortcuts. Here’s the Deep Dive view, which mirrors the layout of the TUI Deep Dive page:
The Usage tab is the same view as in the TUI, with per-tool consoles for each of the five supported tools and the Codex rate-limit windows visible alongside the 24-hour totals:
If you have both installed, you can use whichever suits the moment. I tend to leave the desktop app open on a second monitor when I’m doing a lot of AI-assisted work, and reach for the TUI when I’m already in a terminal and want to spot-check spend on a specific project.
Tray popover and background alerts
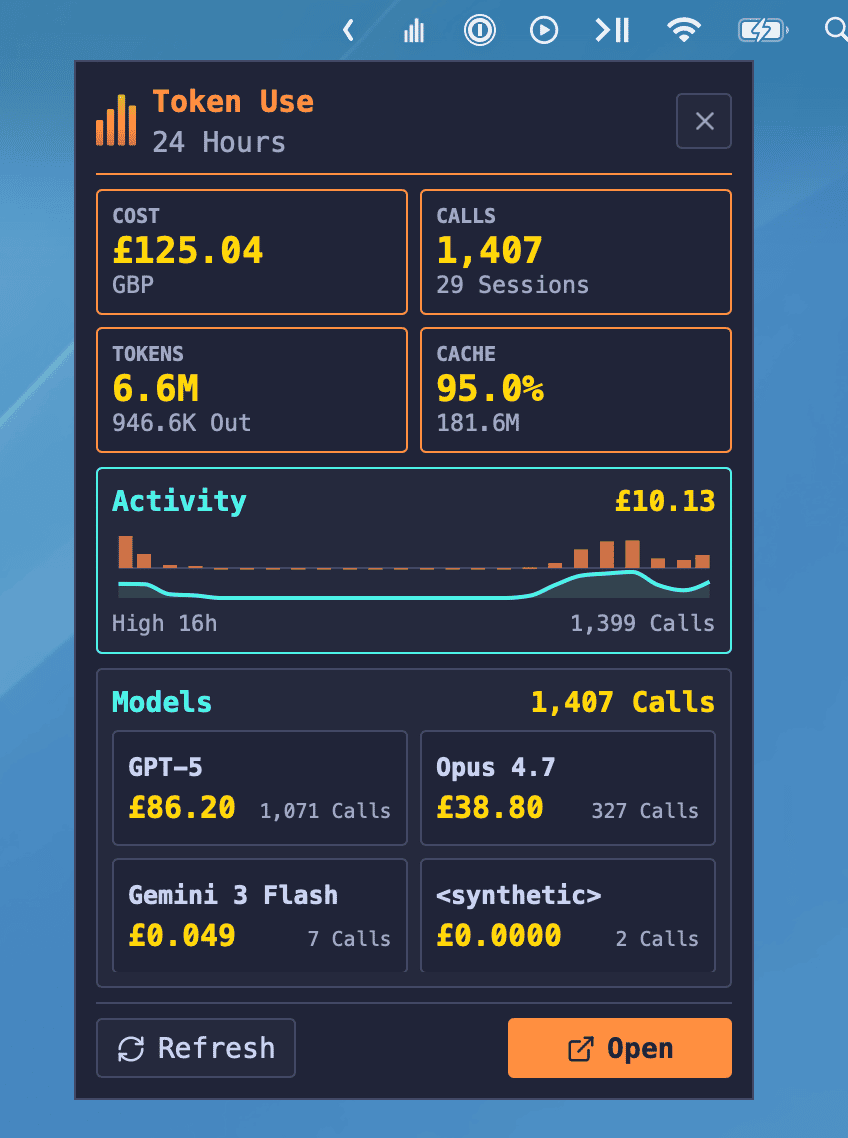
Closing the desktop window doesn’t quit the app: Token Use keeps running in the background, and on macOS the Dock icon will reopen the main window if you click it again. Left-clicking the tray or menu-bar icon opens a compact 24-hour popover with KPI tiles for cost, calls, tokens, and cache hit rate, an Activity sparkline, and a top-models breakdown. There’s an Open button if you want the full dashboard, a Refresh button if you want to force a sync, and right-clicking the icon gives you the native menu with Show Token Use and Quit Token Use.
While it’s running in the background, the desktop app keeps polling the archive for new usage. If an automatic refresh imports a chunk of new activity that crosses configurable thresholds, you get a native desktop notification. The defaults are conservative (notify after at least $1.00, 100k tokens, or 25 calls of new usage, with a 30-minute cooldown) and they live in the same config.json the TUI reads:
{ "currency": "GBP", "background_alerts": { "enabled": true, "min_cost_usd": 1.0, "min_tokens": 100000, "min_calls": 25, "cooldown_minutes": 30 }, "desktop": { "open_at_login": false, "show_dock_or_taskbar_icon": true }}The desktop-only Open at Login and Dock/taskbar icon toggles are also exposed in the Config tab, so you can opt into a tray-first setup without hand-editing JSON if you’d rather. On Windows and Linux, the Config tab additionally includes an explicit update check against GitHub Releases, which is the supported path for those platforms; macOS desktop updates continue to come through Homebrew Cask.
Reports
This is the bit that’s changed the most since the first release. The earlier snapshot exports have been replaced with a richer Reports workflow. Press e on Overview, Deep Dive, Usage, or Session (or click the report button in the desktop app) and you’ll get a modal that asks for the period, project scope, format, and whether to redact prompts, commands, raw paths, session IDs, and dedup keys before generation. Reports always include all tools for the chosen scope, regardless of whatever tool filter you have set on the dashboard.
The available formats cover most use cases:
| Format | Output |
|---|---|
| HTML | One self-contained executive report deck |
| One A4 landscape render of the same deck (browserless) | |
| SVG | One 16:9 visual summary with KPI strip, heatmap, and top highlights |
| PNG | Same one-page visual summary, rasterised |
| JSON | One pretty-printed full report dataset |
| Excel | One multi-sheet .xlsx workbook with summary and raw data sheets |
| CSV | One folder with one CSV per report area |
The HTML and PDF decks are intended to be client-ready, with cover metadata, KPI ribbons, insight tiles, activity pages, and breakdown pages.
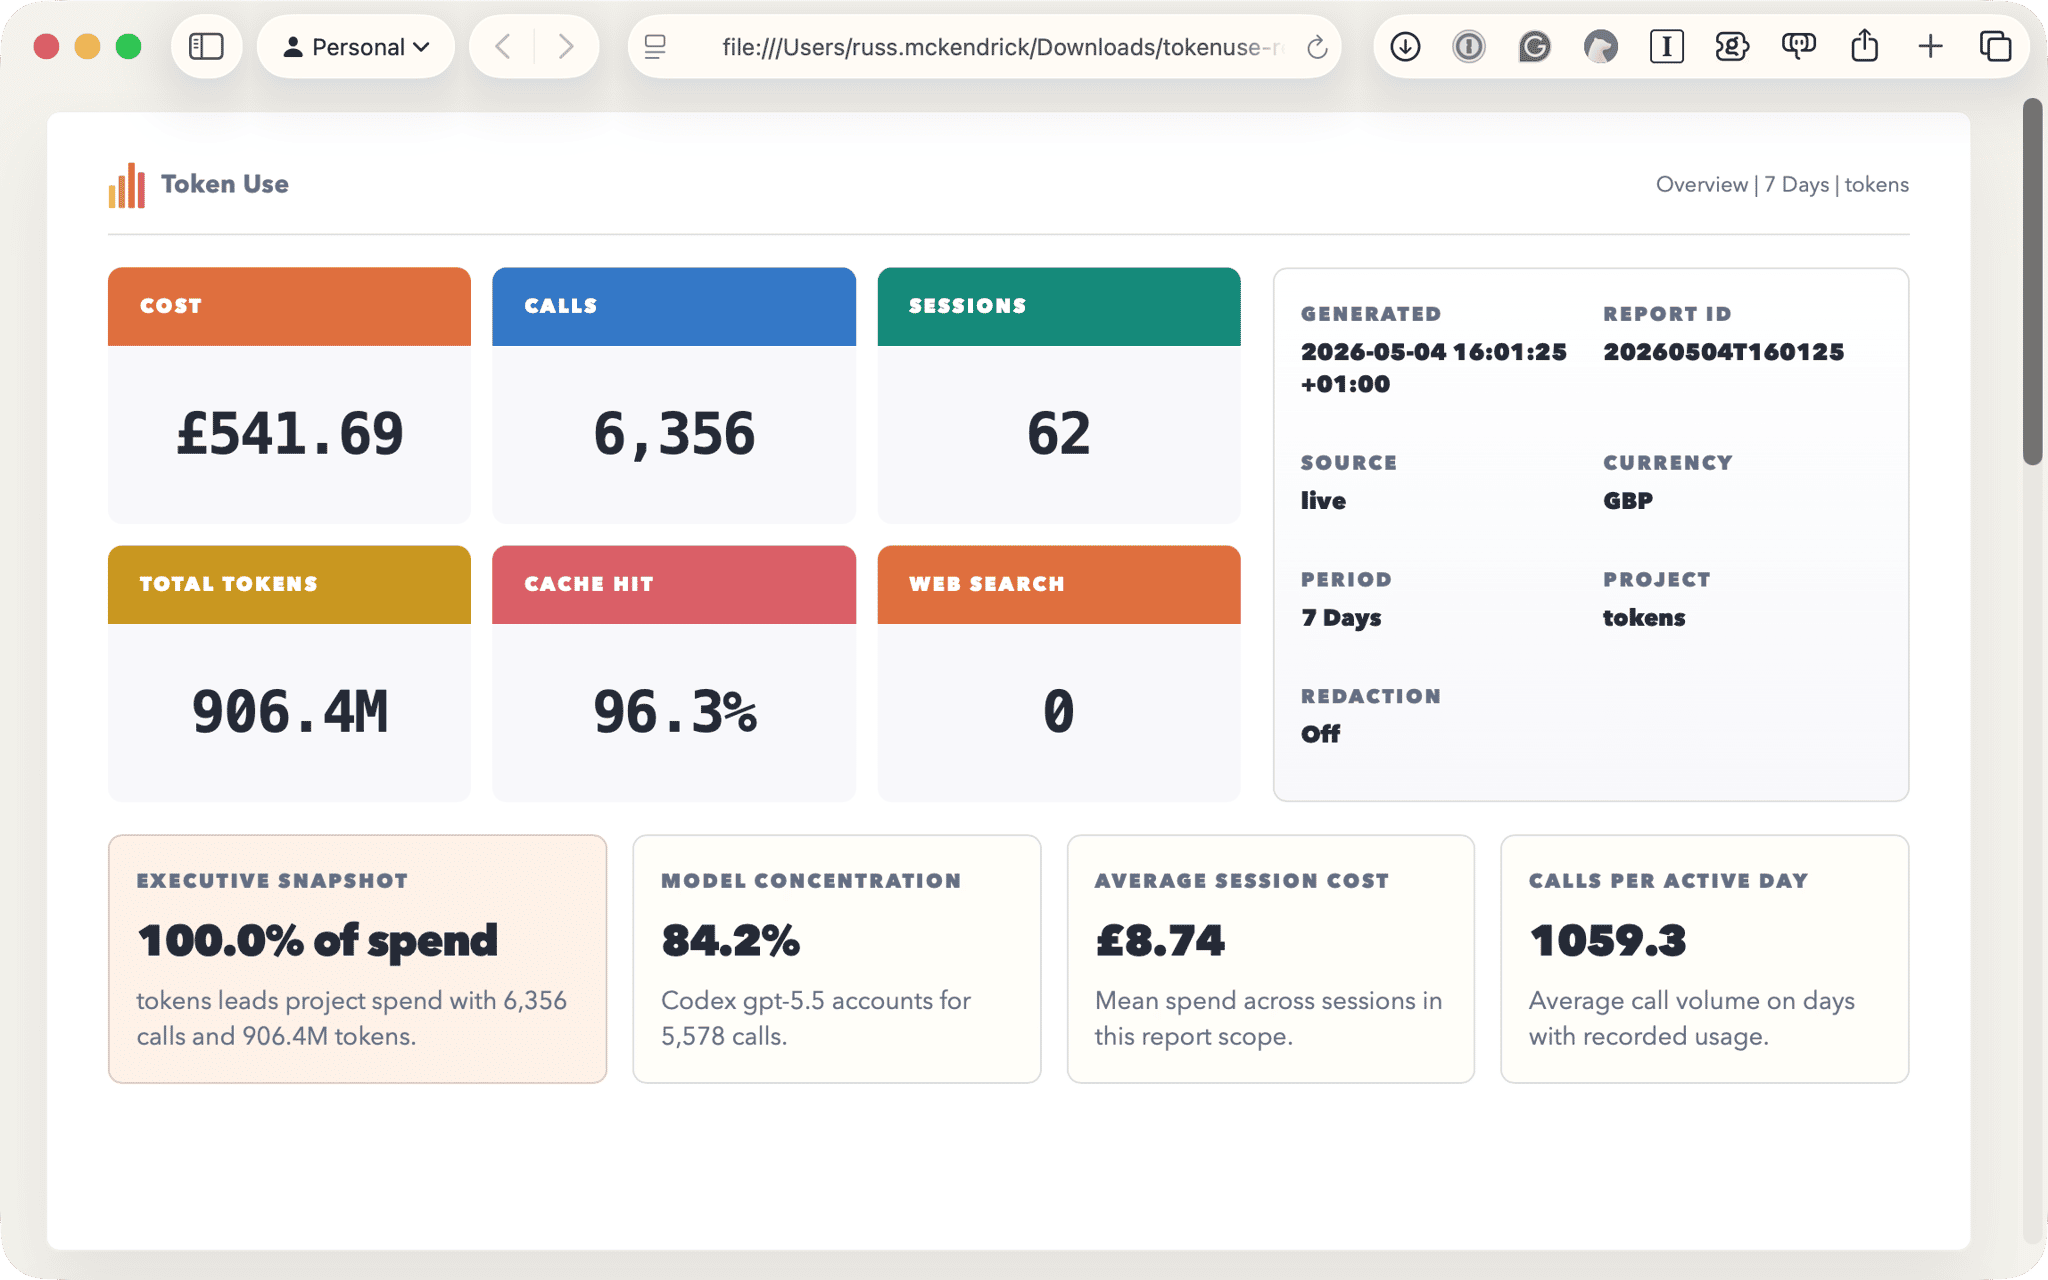
The SVG and PNG outputs are the one-page version for when you just want a single visual summary. JSON, Excel, and CSV are the raw data formats for if you want to do your own analysis. Output defaults to your Downloads folder, falling back to ~/Downloads and then the local config directory, with timestamped, slugged filenames so re-running doesn’t overwrite the previous report.
There’s also a guided CLI for when you want a report without opening the dashboard:
tokenuse reportThis walks through the same period, project, format, output folder, redaction, and confirmation steps as the modal, then exits. It only writes from live local sessions, so it bails out cleanly if there’s nothing to report on.
Privacy
Token Use is local-only by design. There is no telemetry or analytics, and no API keys to provide for any of the supported tools. The only outbound network requests are the explicit Config-page downloads for currency rates and the pricing snapshot, the optional update checks on the Windows and Linux desktop apps, and (on tagged builds) the maintainer release paths. Each of those needs confirmation before it fires.
If you’re security-conscious about a tool that reads your session transcripts, the source is on GitHub. The parsers live under src/tools/<name>/ if you want to verify exactly what’s being read, and the documentation on tokenuse.app has a parser-by-parser breakdown covering each tool’s quirks.
Summary
The source code for Token Use lives at:
It’s still early in its life, so there are bound to be edge cases I haven’t hit yet, particularly across the five different tool formats now that Gemini CLI has joined the lineup. If you spot something off in the parsing, or if there’s a feature that would make the tool more useful for your workflow, issues and pull requests are welcome.
If nothing else, having the data has changed how I think about my AI tool usage. Knowing that a particular kind of refactoring task tends to cost a few quid, while a quick code review costs almost nothing, is the sort of thing that’s hard to internalise without seeing the numbers laid out next to each other. Whether you end up doing more of the cheap things or fewer of the expensive ones is up to you.